.jpg?width=300&height=175&name=Mega%20Menu%20Image%20(1).jpg)
%20(1).jpg?width=300&height=175&name=Mega%20Menu%20Image%20(2)%20(1).jpg)
%20(1)-Mar-08-2024-09-27-14-7268-PM.jpg?width=300&height=175&name=Untitled%20design%20(6)%20(1)-Mar-08-2024-09-27-14-7268-PM.jpg)

%20(1)-Mar-08-2024-09-11-30-0067-PM.jpg?width=300&height=175&name=Untitled%20design%20(3)%20(1)-Mar-08-2024-09-11-30-0067-PM.jpg)
%20(1).jpg?width=300&height=175&name=Mega%20Menu%20Image%20(3)%20(1).jpg)
%20(1).jpg?width=300&height=175&name=Mega%20Menu%20Image%20(4)%20(1).jpg)
%20(1).jpg?width=300&height=175&name=Mega%20Menu%20Image%20(5)%20(1).jpg)
-Mar-08-2024-08-50-35-9527-PM.png?width=300&height=175&name=Untitled%20design%20(1)-Mar-08-2024-08-50-35-9527-PM.png)


.jpg)


There is a tendency for investors to focus their attention and investment dollars on assets located within the United States. This tendency is well documented and is referred to as Home Country Bias. People are generally more comfortable with the familiar and there is a certain sense of safety that comes with investing in what you recognize. The fact that the U.S. market has performed much better than its international counterpart in recent years further reinforces investor preference for domestic assets. Is this lack of international exposure wise? Or are these investors missing out on a significant opportunity by not allocating (more) internationally?
A strong argument can be made for maintaining a sizable allocation to international stocks. The benefit can generally be boiled down to a reduction in portfolio
The reduction in portfolio risk is primarily a function of diversification. The behavior of the various stock markets across the globe will differ based on their own set of circumstances, each with unique growth prospects, fiscal and monetary policies, regulatory framework, and tax structures. Globalization has increased the tendency for different markets to behave in similar fashion, but they remain far from perfectly correlated. In normal market
The chart below demonstrates the impact on portfolio risk of adding international exposure to an all U.S. stock allocation. The
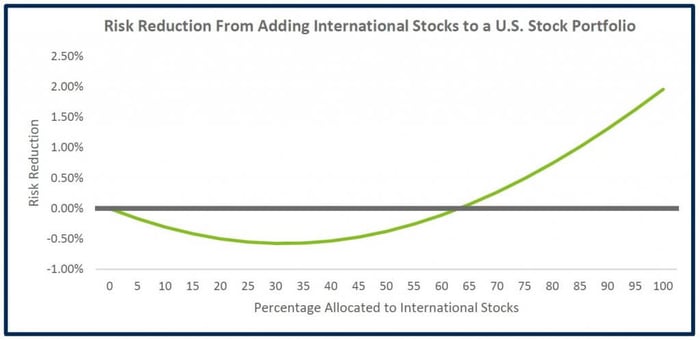
Source: Morningstar Direct and DFA. U.S. stocks represented by the Russell 3000 TR index. International stocks represented by the MSCI EAFE NR Index from 1/1979 through 12/1998, and the MSCI ACWI
U.S. stocks have outperformed international stocks for much of the period following the 2008 financial crisis. The scale of the recent outperformance in terms of time and degree can easily lead investors to believe that this is the norm, but is this belief justified? To answer this question, we looked at the relative performance between U.S. and international stocks on a rolling five-year basis going back as far as we have data. The chart below reflects the results of this analysis, and clearly illustrates the relative performance between the two are cyclical. There have been several extended periods over the last 40 years where international stocks handily outperformed the U.S. market.
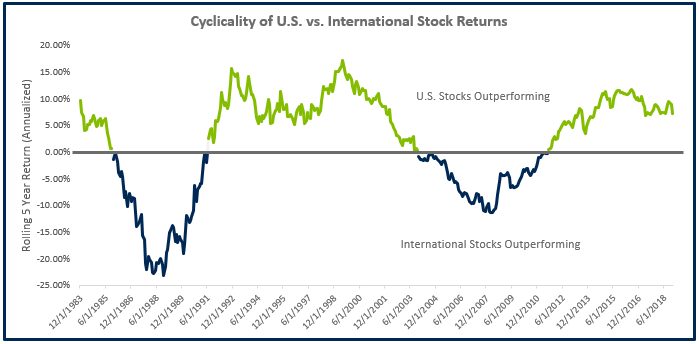
Source: Morningstar Direct and DFA. U.S. stocks represented by the Russell 3000 TR index. International stocks represented by the MSCI EAFE NR Index from 1/1979 through 12/1998, and the MSCI ACWI
If we know international markets have outperformed in the past, do we have reason to believe they could again outperform in the future? The key to this question could lie in the relative valuation between the two.
Valuation is a measure of how cheap or expensive a stock (or entire market) is and is one of the best predictors of return over the long run. It is generally quoted in terms of the price paid for a unit of some fundamental figure, such as earnings. In simple terms: the lower the price you pay for an asset, the better the chance it is going to deliver an attractive return. Finally, relative valuation simply compares how cheap or expensive one investment is relative to another.
The chart below applies the relative valuation technique to the comparison of U.S. vs. international stocks(2). The middle grey bar indicates the level where the two alternatives are equally valued. When the green line is above the top grey line, international stocks are considered expensive. They are considered cheap when the green line is below the bottom grey line. As you can see, international stocks are currently near the cheapest levels relative to U.S. stocks in 18 years (as far back as we have data). This provides a sound basis to expect higher returns from international stocks over U.S. stocks moving forward.
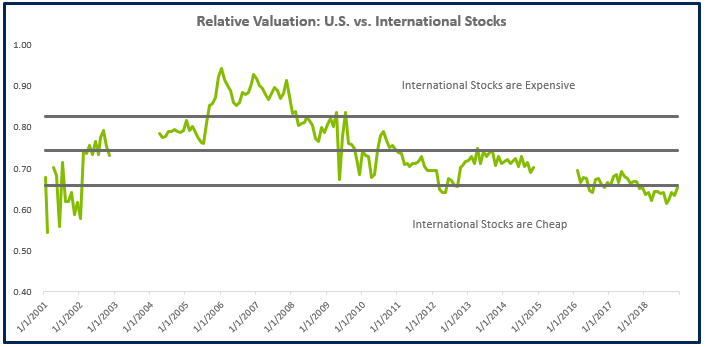
Source: Morningstar Direct. Valuations are based on an equally weighted composite of price/book value, price/earnings, price/sales, and price/cash flow. The chart illustrates the ratio of the international composite over the domestic composite. U.S. stocks were represented by the Russell 3000 index, international stocks were represented by the MSCI EAFE index. Data from 1/2001 to 12/2018. Gaps in the green relative valuation line are due to missing/inconsistent data.
While valuation is arguably the best predictor of long-term returns, it
Though many U.S. based investors exhibit Home Country Bias, there are compelling reasons to consider and/or maintain a meaningful allocation to international stocks. Through the benefit of diversification, adding international stocks can reduce fluctuations in portfolio value. While investors exhibiting Home Country Bias have been rewarded with
Risk in this instance is defined as the standard deviation of returns. The reduction in risk is measured by the spread between the standard deviation of the various blended portfolios and the Russell 3000.- The
Y axis of the relative valuation chart can be interpreted as the discount on buying international stocks vs U.S. stocks. Over the measurementperiod the price paid for international stocks has average 74% of the price paid for U.S. stocks (based on the equally weighted composites of the four price multiples: P/E, P/B, P/S, P/CF). As of year-end2018 the price paid for international was 65% of the U.S. price, meaning you can buy international stocks much more cheaply then you have been able to historically.
IMPORTANT DISCLOSURE INFORMATION

- Competition, Achiever, Relator, Analytical, Ideation
Josh Jenkins, CFA
Josh Jenkins, Chief Investment Officer, began his career in 2010. With a background in investment analysis and portfolio management from his previous roles, he quickly advanced to his current leadership position. As a member of the Lutz Financial Board and Chair of the Investment Committee, he guides Lutz Financial’s investment strategy and helps to manage day-to-day operations.
Leading the investment team, Josh directs research initiatives, while overseeing asset allocation, fund selection, portfolio management, and trading. He authors the weekly Financial Market Update, providing clients with timely insights on market conditions and economic trends. Josh values the analytical nature of his work and the opportunity to collaborate with talented colleagues while continuously expanding his knowledge of the financial markets.
At Lutz, Josh exemplifies the firm’s commitment to maintaining discipline and helping clients navigate market uncertainties with confidence. While staying true to the systematic investment process, he works to keep clients' long-term financial goals at the center of his decision-making.
Josh lives in Omaha, NE. Outside the office, he likes to stay active, travel, and play golf.
Recent News & Insights

Financial Planning Advice for Recent College Grads

2024’s Hot Stocks Have Cooled Fast + 4.23.25

Do You Need a Family Office? 7 Aspects to Consider

Tariff Volatility + 4.7.25

