
%20(1).jpg?width=300&height=175&name=Mega%20Menu%20Image%20(2)%20(1).jpg)
%20(1)-Mar-08-2024-09-27-14-7268-PM.jpg?width=300&height=175&name=Untitled%20design%20(6)%20(1)-Mar-08-2024-09-27-14-7268-PM.jpg)

%20(1)-Mar-08-2024-09-11-30-0067-PM.jpg?width=300&height=175&name=Untitled%20design%20(3)%20(1)-Mar-08-2024-09-11-30-0067-PM.jpg)
%20(1).jpg?width=300&height=175&name=Mega%20Menu%20Image%20(3)%20(1).jpg)
%20(1).jpg?width=300&height=175&name=Mega%20Menu%20Image%20(4)%20(1).jpg)
%20(1).jpg?width=300&height=175&name=Mega%20Menu%20Image%20(5)%20(1).jpg)
-Mar-08-2024-08-50-35-9527-PM.png?width=300&height=175&name=Untitled%20design%20(1)-Mar-08-2024-08-50-35-9527-PM.png)


.jpg)


If you’re a business owner or manager, you’re constantly juggling numerous ongoing projects. You need to know the status of each as you start your workday, so you probably consult notes and files, a spreadsheet, or maybe a project management application. Probably the most important of these involves the state of your finances. How do you get a quick daily review of this critical issue? If you’re doing your accounting manually, it’s difficult to impossible. QuickBooks provides a one-page overview of your need-to-know numbers: the Company Snapshot. If you’ve been recording transactions and other data conscientiously, you can consult this screen and expect a fast, reliable update. Open the Company menu and select Company Snapshot to get there.

The nine panes available in the Company Snapshot aren’t meant to replace the reports you should be running regularly. You still need an occasional in-depth review of, for example, outstanding invoices and unpaid bills, sales and expenses, and inventory levels. QuickBooks includes templates for dozens of them, and we can help you analyze the most complex ones. As its name implies, the Company Snapshot consists of multiple at-a-glance charts and tables that summarize your current financial state. You can see quickly what’s going well and where there are problems to be addressed. 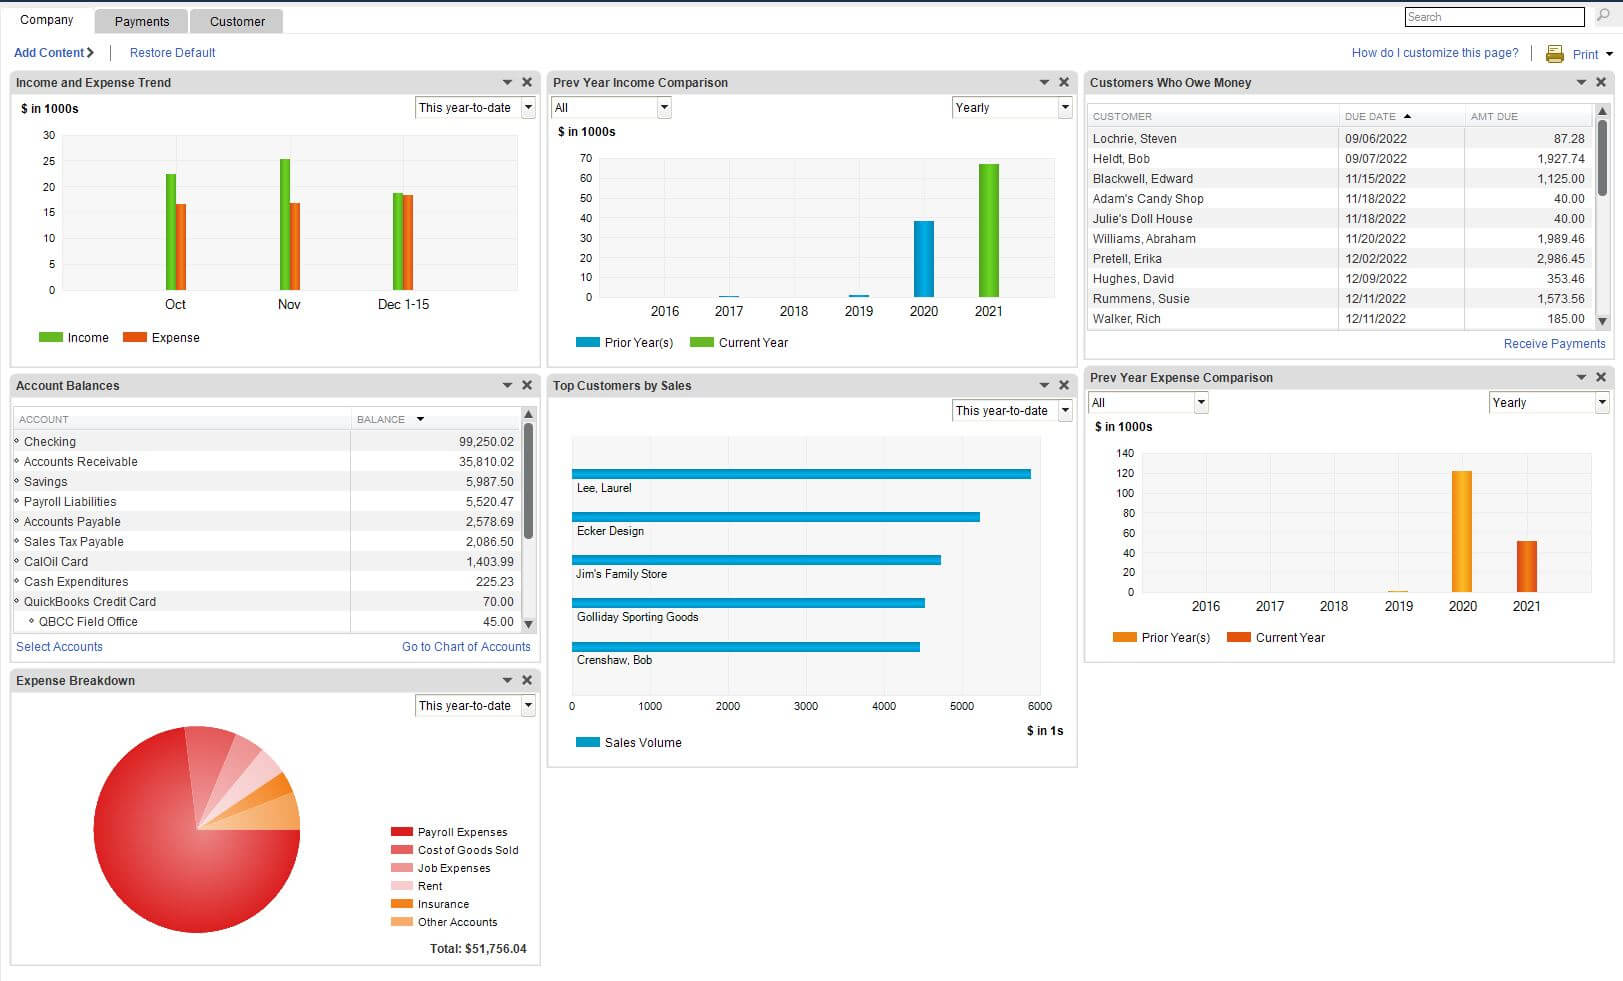
QuickBooks comes with a default set of panes, but you can see more by clicking Add Content in the upper left. You can also click and drag them around so they’ll appear in a different configuration. And for some, you can modify the date range of the data. Here is a sample of information addressed in these mini-windows:
What are the major sources of my income?
Besides displaying your total income for a given period, this pie chart is color-coded by account. Hover your cursor over any segment to see how much of your income originated there.Who owes me money?
This table includes the due date and amount due.

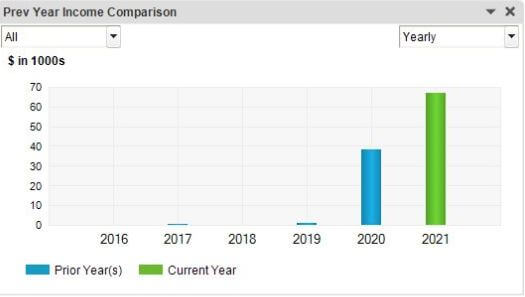
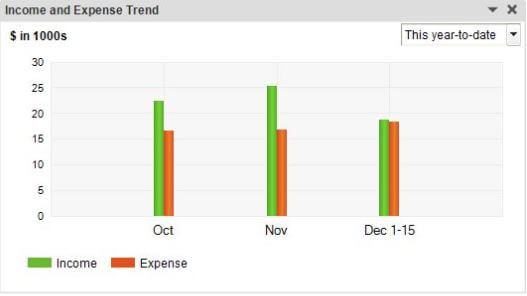
How does my income compare to previous time periods?
You can view this line graph by week, month, quarter, or year, and include all income sources or just one.
What are my upcoming financial task deadlines?
This is a table of reminders with due dates.Who are my best customers?
Select one of multiple date range options to see a line graph of your top five customers by sales.

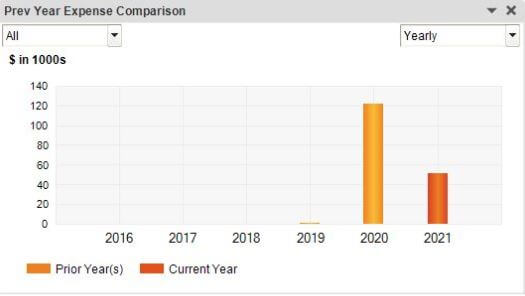
How do my current expenses compare to those of previous weeks, months, quarters, and years?
This line graph illustrates the totals.
How has my income compared to my expenses over a given time period?
You’ll see instantly which is running ahead in this chart.
What are my account balances?
This table provides you with this information.

Where am I spending money?
You can view this expense breakdown by time period and account name.

If you’re not using QuickBooks yet and would like to explore the possibility, or you want an expert firm to take over your accounting, connect with us. We’ve helped countless small businesses do both, and we’d be happy to work with you.
Recent News & Insights

This is What Volatility Looks Like

Lutz Financial Celebrates 25 Years of Service

Lutz Named a 2026 Top 100 Firm by Accounting Today

What History Says About Markets & Global Conflict

