%20(1)-Jan-02-2024-09-05-00-8712-PM.jpg?width=300&height=175&name=Untitled%20design%20(2)%20(1)-Jan-02-2024-09-05-00-8712-PM.jpg)
%20(1)-Mar-08-2024-09-22-41-1011-PM.jpg?width=300&height=175&name=Untitled%20design%20(5)%20(1)-Mar-08-2024-09-22-41-1011-PM.jpg)
%20(1)-Mar-08-2024-09-27-14-7268-PM.jpg?width=300&height=175&name=Untitled%20design%20(6)%20(1)-Mar-08-2024-09-27-14-7268-PM.jpg)

%20(1)-Mar-08-2024-09-11-30-0067-PM.jpg?width=300&height=175&name=Untitled%20design%20(3)%20(1)-Mar-08-2024-09-11-30-0067-PM.jpg)
%20(1)-Mar-08-2024-09-18-53-4361-PM.jpg?width=300&height=175&name=Untitled%20design%20(4)%20(1)-Mar-08-2024-09-18-53-4361-PM.jpg)
-Mar-08-2024-09-03-21-1119-PM.jpg?width=300&height=175&name=Untitled%20design%20(1)-Mar-08-2024-09-03-21-1119-PM.jpg)
-2.png?width=264&height=160&name=Website%20Featured%20Content%20Images%20(1)-2.png)
-Mar-08-2024-08-50-35-9527-PM.png?width=300&height=175&name=Untitled%20design%20(1)-Mar-08-2024-08-50-35-9527-PM.png)


.jpg)


STORY OF THE WEEK
VALUE STOCKS STAGE A COMEBACK
Value investors have endured an extended stretch of relative underperformance. For the better part of the last decade, shares of companies with a low price relative to fundamentals have lagged those that have exhibited rapid growth. More recently, however, value has been making a comeback. So what is the premise behind tilting towards value? And should investors count on value continuing to outperform?
There is considerable empirical evidence that supports the existence of a ‘Value Premium.’ The term value premium is investment jargon that simply means investors that tilt their portfolio toward value should expect to earn a return in excess of what would be earned by tilting toward growth. The chart below from Dimensional Fund Advisors (DFA) illustrates some of that evidence. It compares the long-term historical return of value relative to growth across a variety of markets. Note that the shorter period analyzed for developed ex US and emerging markets is a function of data availability.
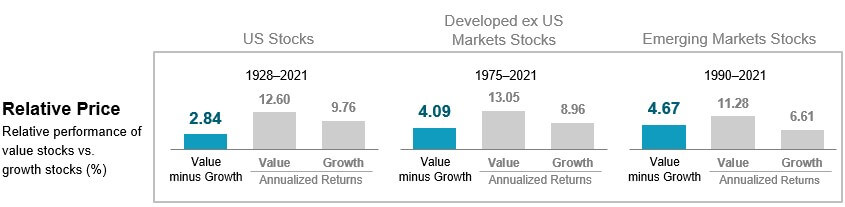
Information provided by Dimensional Fund Advisors LP.
Index returns are not representative of actual portfolios and do not reflect costs and fees associated with an actual investment. MSCI indices are gross div. US stock indices were Value minus Growth: Fama/French US Value Research Index minus the Fama/French US Growth Research Index. For developed ex US stocks, indices were the Value minus Growth: Fama/French International Value Index minus the Fama/French International Growth Index. For Emerging Markets stocks, indices were the Value minus Growth: Fama/French Emerging Markets Value Index minus Fama/French Emerging Markets Growth Index
The blue bars indicate the relative performance of value versus growth in each of the perspective markets. In each case, the long-term return has been materially higher for value. This excess return is referred to as the Value Premium.
While value stocks have outperformed on average over time, that doesn’t mean they outperform all the time. DFA has an excellent chart (below) to help us visualize this. They calculated the rolling 10-year annualized return difference between value and growth between 1927-2021 and sorted them from the largest value underperformance to the largest value outperformance.
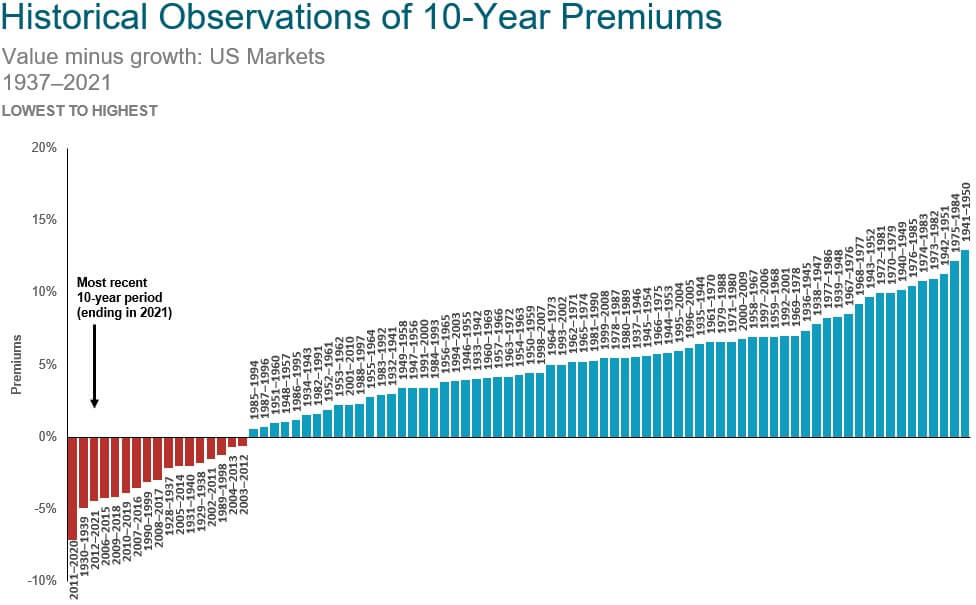
Information provided by Dimensional Fund Advisors LP.
Past performance is no guarantee of future results. Actual returns may be lower.
Index returns are not representative of actual portfolios and do not reflect costs and fees associated with an actual investment. 10-year premiums are calculated as the difference in annualized 10-year returns between the two indices described. Value minus Growth: Fama/French US Value Research Index minus the Fama/French US Growth Research Index.
Over this timeframe, the frequency that value stocks outperformed growth in a given year was about 59%. While this may not sound like a great success rate, consider that professional sports bettors typically have a win rate in the mid-50s. Now consider a longer-term investor that can hold stocks for a 10-year period. The frequency that value has outperformed on a 10-year run going back to the 1920s has been about 80%. Talk about putting the odds in your favor!
Still, even with a high historical success rate, value has experienced long and painful periods of underperformance. Interestingly, the bulk of the negative 10-year returns in the above graph occurred during three distinct periods:
- The Great Depression
- The Technology Bubble
- Post 2010
Those earlier periods of growth dominance eventually came to an end. In fact, growth’s recent outperformance appears to have peaked in August of 2020. Since that time, value has been outperforming by an annualized 10.9%. While this reversal has been incredibly vindicating for value investors, it is not a foregone conclusion that it will continue. Still, given the nearly 100 years of empirical evidence, maintaining a strategic tilt towards value is an excellent way for an investor to stack the odds in their favor.
WEEK IN REVIEW
- The second quarter earnings season continues to press on, with 87% of S&P 500 companies having reported results according to FactSet. The blended earnings growth rate, using actual data from companies that have reported and expectations for those that have yet to report, has increased to 6.7%. Entering earnings season, earnings were expected to increase by 4.0%.
- On Wednesday, the Labor Department will provide a fresh look at inflation when it publishes its Consumer Price Index (CPI) for July. According to MarketWatch, economists are expecting headline inflation to decrease from 9.1% to 8.7% on a year-over-year basis. Core inflation, which excludes the volatile food and energy components, is expected to increase from 5.9% to 6.1% year-over-year. Inflation data will continue to have the highest potential to move markets, given it is the primary focus of monetary policy.
- Other data to be published this week includes initial jobless claims on Thursday and the University of Michigan consumer sentiment and inflation expectations surveys on Friday.
LFS BLOG
- Investor Do’s and Don’ts During a Bear Market
- Why Investors Should Own International Stocks
- 3 Things All Investors Should Know
ECONOMIC CALENDAR
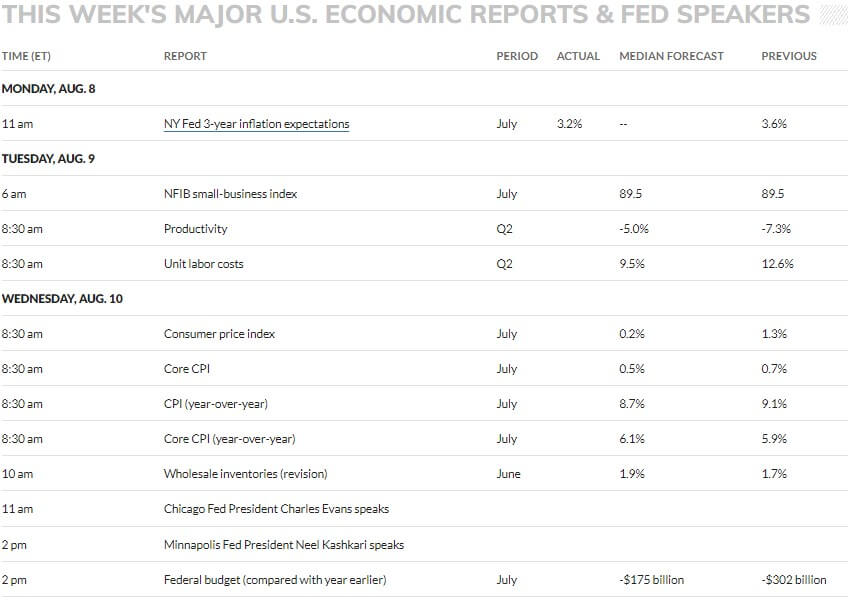
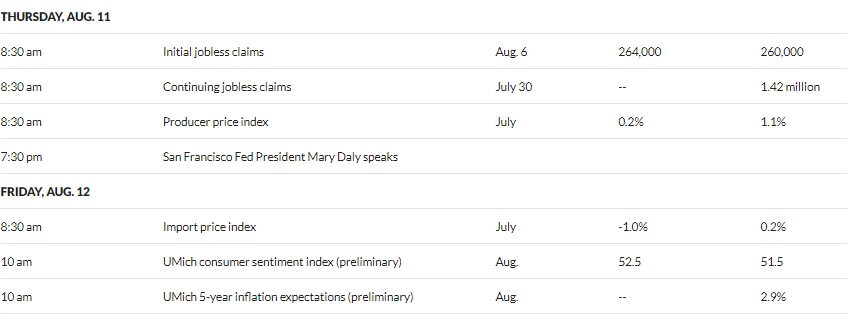
Source: MarketWatch
HOT READS
Markets
- Consumers Expect Inflation to Slow Down, A Big Win for the Fed (CNBC)
- Food Prices Fell Sharply in July – But the Respite May Not Last (CNBC)
- Rapid Wage Growth Keeps Pressure on U.S. Inflation (WSJ)
Investing
- The Michael Scott Economy (Ben Carlson)
- Reality Catches Up (Morgan Housel)
- Things are Clear as Mud (Michael Batnick)
Other
- The US-China Tit-For-Tat Escalations are Very Dangerous (Ray Dalio)
- What to Know About 988, the New Suicide and Crisis Lifeline (Wired)
- These Were the Most Frequently Stolen Vehicles of 2021 (Car & Driver)
MARKETS AT A GLANCE
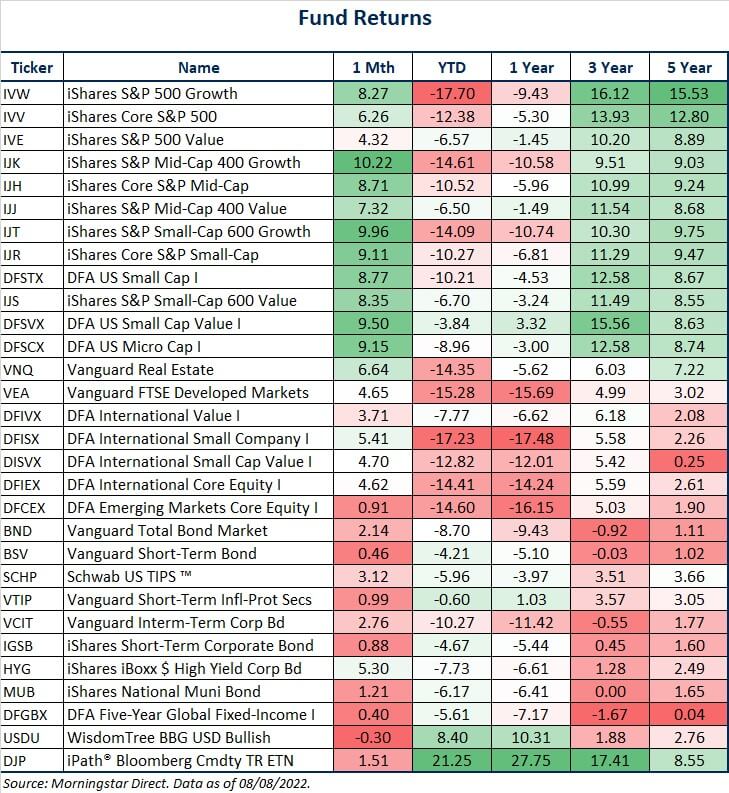
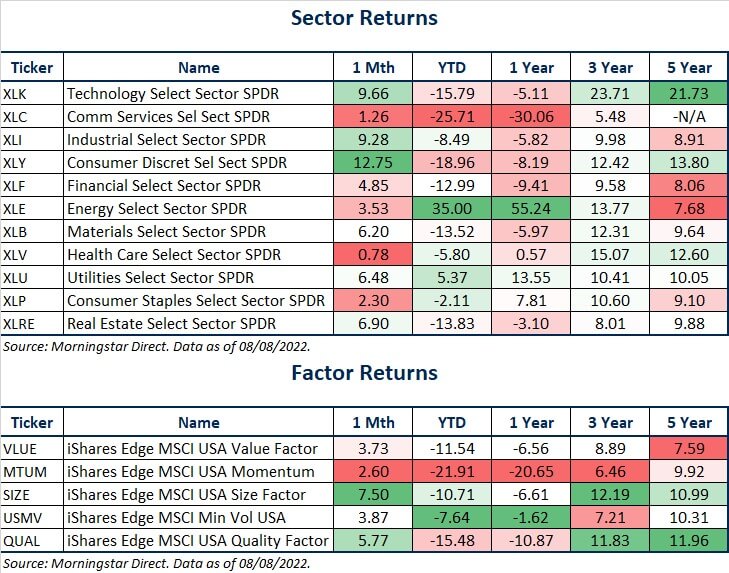
Source: Morningstar Direct.
Source: Morningstar Direct.
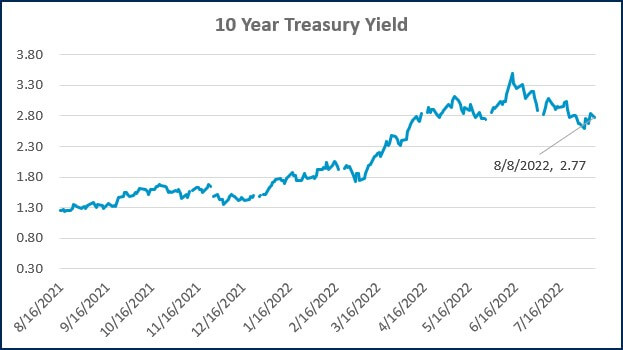
Source: Treasury.gov

Source: Treasury.gov
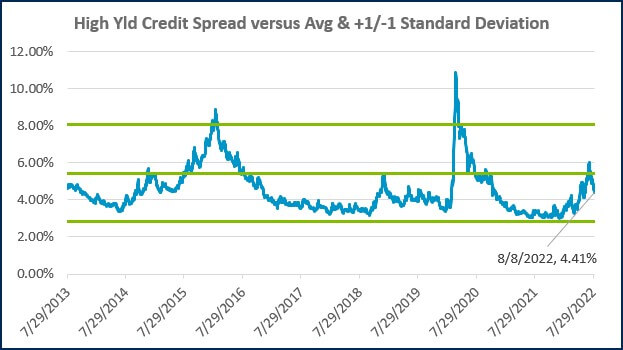
Source: FRED Database & ICE Benchmark Administration Limited (IBA)
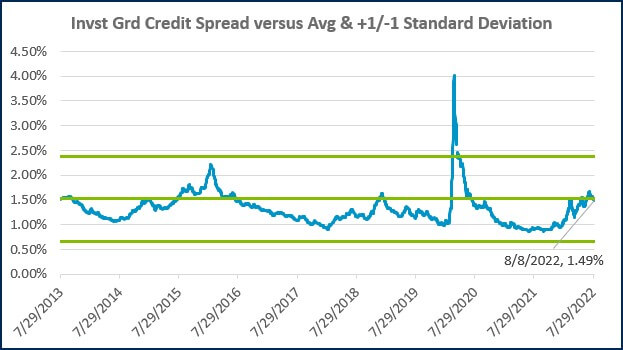
Source: FRED Database & ICE Benchmark Administration Limited (IBA)

- Competition, Achiever, Relator, Analytical, Ideation
Josh Jenkins, CFA
Recent News & Insights

Are Non-GAAP Measures Helpful or Harmful?

Microsoft 365 Email Security: What You Need to Know

5 Ways Automated Accounting Software Can Save Your Business Money

What to Consider When Choosing a Financial Advisor

