.jpg?width=300&height=175&name=Mega%20Menu%20Image%20(1).jpg)
%20(1).jpg?width=300&height=175&name=Mega%20Menu%20Image%20(2)%20(1).jpg)
%20(1)-Mar-08-2024-09-27-14-7268-PM.jpg?width=300&height=175&name=Untitled%20design%20(6)%20(1)-Mar-08-2024-09-27-14-7268-PM.jpg)

%20(1)-Mar-08-2024-09-11-30-0067-PM.jpg?width=300&height=175&name=Untitled%20design%20(3)%20(1)-Mar-08-2024-09-11-30-0067-PM.jpg)
%20(1).jpg?width=300&height=175&name=Mega%20Menu%20Image%20(3)%20(1).jpg)
%20(1).jpg?width=300&height=175&name=Mega%20Menu%20Image%20(4)%20(1).jpg)
%20(1).jpg?width=300&height=175&name=Mega%20Menu%20Image%20(5)%20(1).jpg)
-Mar-08-2024-08-50-35-9527-PM.png?width=300&height=175&name=Untitled%20design%20(1)-Mar-08-2024-08-50-35-9527-PM.png)


.jpg)


The stock market recovery that lifted share prices through the end of last year has continued into 2024. By mid-January, the large-cap stocks of the S&P 500 had fully recovered from the bear market in 2022 and reached a new all-time high. Since then, stocks have continued to make gains, closing at a new high in 14 out of the last 30 trading sessions. When the stock market enters this kind of unchartered territory, investor emotions tend to become elevated. The optimists view the recent strength as an unstoppable trend destined to continue, while the pessimists see new highs as a sign the market is overvalued and doomed to crash back down to earth. Clearly, both groups can’t be right. So, what have new highs meant for market returns historically?
The chart below from Dimensional Fund Advisors (DFA) illustrates historical stock market performance following past all-time highs. The gold bars represent the average annualized 1, 3, and 5-year stock market return going back to 1926. The blue bars reflect the average returns following a new market high.
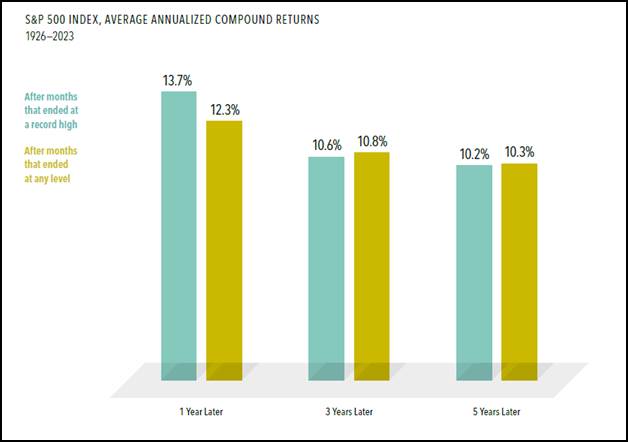
Source: Dimensional Fund Advisors. In US dollars. For illustrative purposes only. New market highs are defined as months ending with the market above all previous levels for the sample period. Annualized compound returns are computed for the relevant time periods subsequent to new market highs and averaged across all new market highs observations. There were 1,175 observation months in the sample. January 1926–December 1989: S&P 500 index, Stocks, Bonds, Bills and Inflation Yearbook™, Ibbotson Associates, Chicago. January 1990–present: S&P 500 index (total return), S&P data © 2024 S&P Dow Jones Indices LLC, a division of S&P Global. All rights reserved.
As you can see, the establishment of a new high tends to be associated with some momentum. Stock returns have historically delivered an above-average return in the year following a new high. Over the longer term, however, new highs seem to be a small headwind. Returns tend to be slightly below average during the subsequent 3-5 years.
The main takeaway from the chart is that the establishment of a new market high is not a reliable signal for shifting an asset allocation to be more aggressive or more conservative. Of course, this doesn’t mean a new high can’t precede a large move. It simply means there is no way to know in what direction the market might go. As we sit here today, there are reasons stocks could keep rising, but also signs the market has become overextended. Investors that reposition their portfolio based on an incorrect guess risk inflicting lasting damage to their nest egg.
Market selloffs, rallies, and new highs are all normal parts of the investment experience. As this chart reveals, the outcome following a new high has not looked materially different than the long-term average. Investors who can remain disciplined over the long term are best positioned to harness the long-term wealth-creating power of the stock market, regardless of whether the market is at an all-time high.
Week in Review
- Natural-Gas futures (For March Delivery) closed at an inflation-adjusted all-time low of $1.57 on February 20th as an unusually warm winter and accelerating US output pushed futures prices to their lowest inflation-adjusted level since they started trading on the New York Mercantile Exchange in 1990. This is welcome news for American Citizens, who, on average, saw their gas costs drop 18% year-over-year in January of 2024.
- The Gold Futures contract for April settled at $2,126.30 per ounce on March 4th, 2024, which is the highest level dating back to the creation of the gold futures contract in 1974. This was the second consecutive trading session in a row in which gold settled at a record as traders continued to bet on the Federal Reserve cutting interest rates. Despite achieving this record, gold has trailed the S&P 500 dramatically over the last ten years (4.8% vs 12.5% per annum).
- According to FactSet, 97% of the S&P 500 has reported Q4 results as of last Friday, February 29th, 2024. The earnings growth rate, blended between companies that have already reported with the estimates for those that have yet to report, is at 4.0% year-over-year, which is above analyst expectations of 1.6% going into this earnings season. This earnings season will mark the second straight quarter in which the S&P 500 has reported year-over-year earnings growth.
Hot Reads
Markets
- Key Fed Inflation Measure Rose 0.4% in January as Expected, Up 2.8% from a year Ago (CNBC)
- One Says 2.4%, Another Says 3.1%. Which Inflation Metric is Right? (WSJ)
- Tax Pros Brace for ‘Tidal Wave’ of Crypto Tax Scrutiny from the IRS. What Investors Need to know (CNBC)
Investing
- Buy & Hold vs. Fear & Greed (Ben Carlson)
- The Fear of Missing Out (Michael Batnick)
- The Dumber Side of Smart People (Morgan Housel)
- How Stretching Actually Changes Your Muscles – Ted-Ed (YouTube)
- NASA’s Pricey Mission To Send US Back to Moon Faces Technical Challenges – 60 Minutes (YouTube)
- ‘Full Swing 2’: The Good, the Bad and the Provocative (GolfDigest)
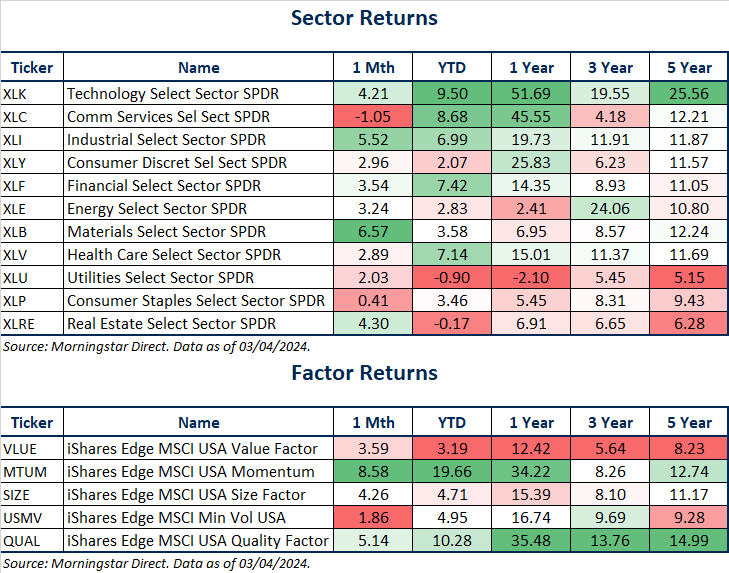
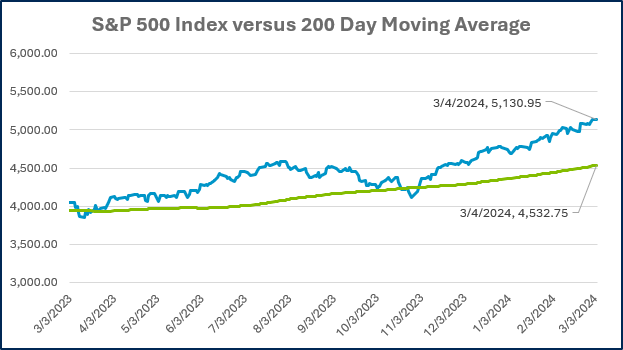
Markets at a Glance
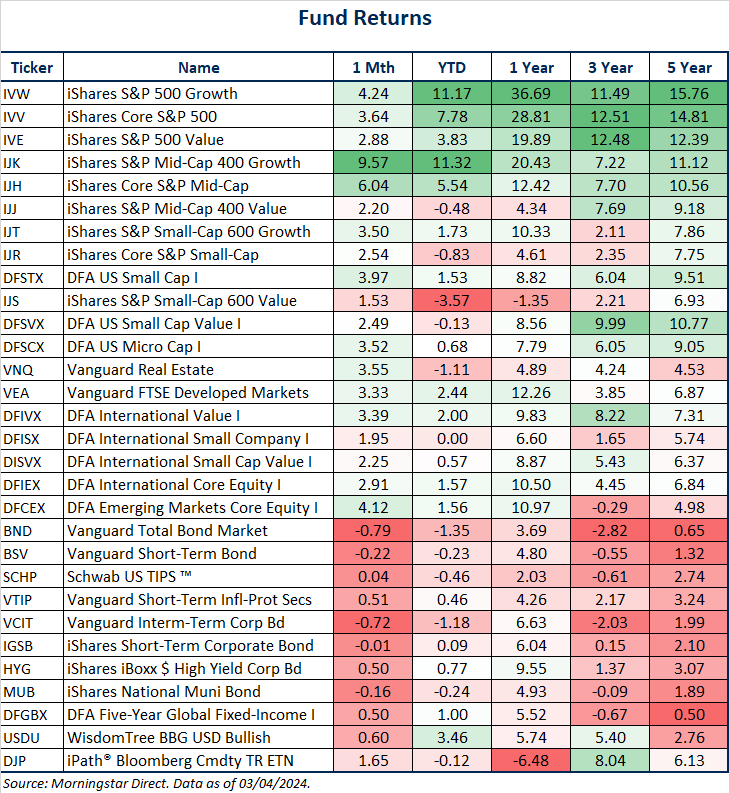
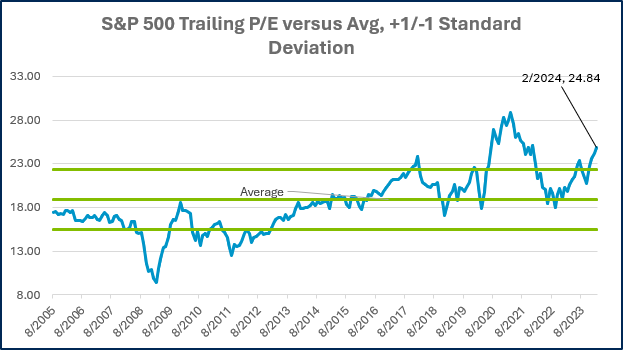
Source: Morningstar Direct.
Source: Morningstar Direct.
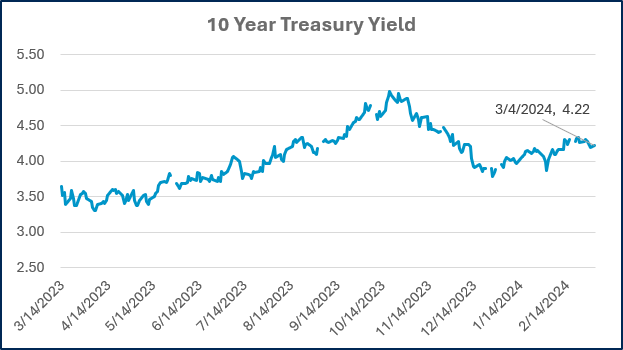
Source: Treasury.gov
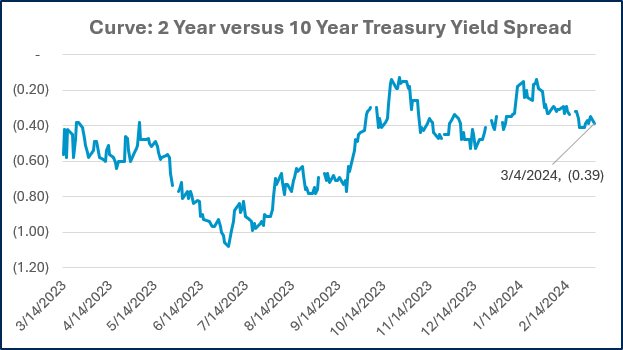
Source: Treasury.gov
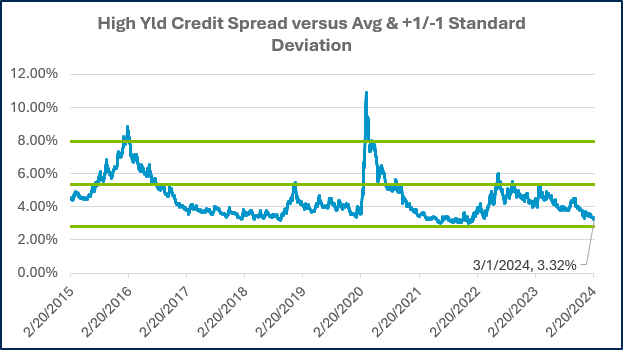
Source: FRED Database & ICE Benchmark Administration Limited (IBA)
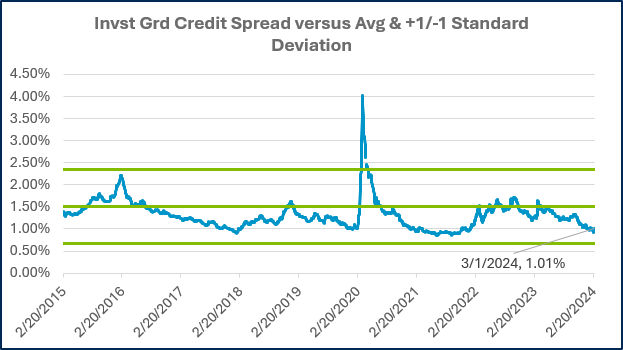
Source: FRED Database & ICE Benchmark Administration Limited (IBA)
Economic Calendar
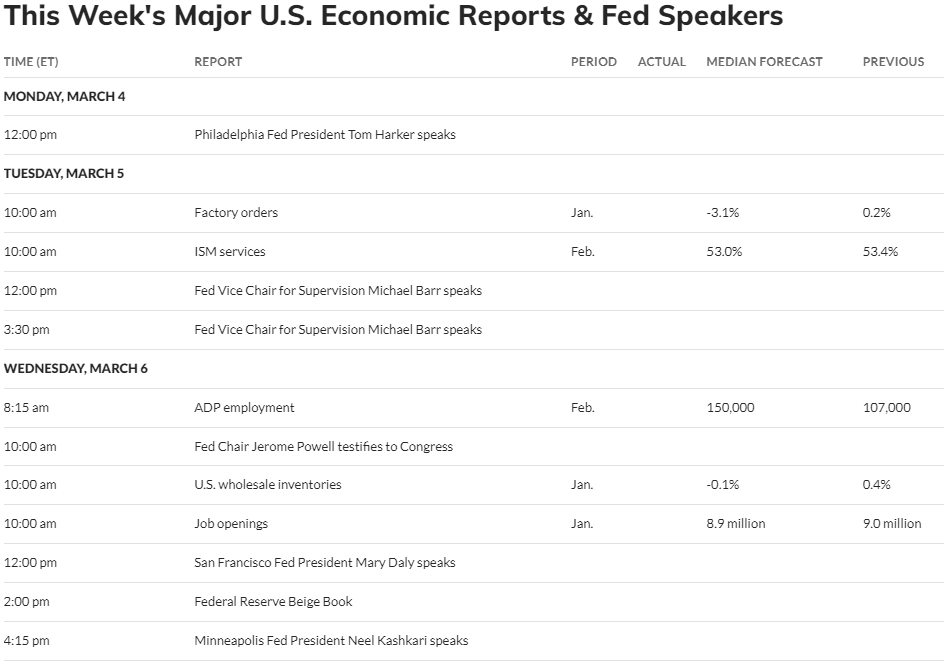
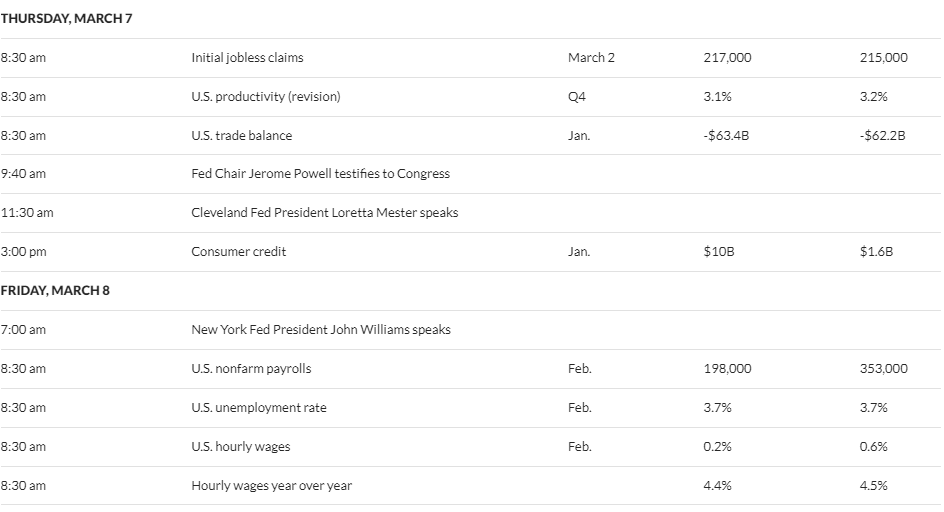
Source: MarketWatch

- Competition, Achiever, Relator, Analytical, Ideation
Josh Jenkins, CFA
Chief Investment Officer, Principal
Josh Jenkins, Chief Investment Officer, began his career in 2010. With a background in investment analysis and portfolio management from his previous roles, he quickly advanced to his current leadership position. As a member of the Lutz Financial Board and Chair of the Investment Committee, he guides Lutz Financial’s investment strategy and helps to manage day-to-day operations.
Leading the investment team, Josh directs research initiatives, while overseeing asset allocation, fund selection, portfolio management, and trading. He authors the weekly Financial Market Update, providing clients with timely insights on market conditions and economic trends. Josh values the analytical nature of his work and the opportunity to collaborate with talented colleagues while continuously expanding his knowledge of the financial markets.
At Lutz, Josh exemplifies the firm’s commitment to maintaining discipline and helping clients navigate market uncertainties with confidence. While staying true to the systematic investment process, he works to keep clients' long-term financial goals at the center of his decision-making.
Josh lives in Omaha, NE. Outside the office, he likes to stay active, travel, and play golf.
Recent News & Insights

Financial Planning
Financial Planning Advice for Recent College Grads
We are approaching graduation season, and with that comes a new crop of freshly minted college ...

Market Commentary
2024’s Hot Stocks Have Cooled Fast + 4.23.25
A handful of tech giants stole the show in 2024. Just a few months into the new year, they’ve ...

Family Office
Do You Need a Family Office? 7 Aspects to Consider
As your wealth grows—whether through a successful business, inheritance, or years of strategic ...

Market Commentary
Tariff Volatility + 4.7.25
Last week, the President hit virtually the whole world with reciprocal tariffs that were far ...


Let’s get you where you want to go.
We work to simplify complexities, help make critical business decisions, and confidently focus on the things that are truly important to you. We embrace your business as our own to spark the right solutions and help you thrive.