Do active funds beat the market? + 3.19.24

For decades there has been a contentious debate around the use of active versus passive investment options. Historically, active managers, which I will define as those who pick individual stocks and bonds with the goal of beating the market, dominated the fund industry. In recent decades, however, there has been a tidal wave of money flowing into passive investment options, and for good reason.
There is a significant body of research from both academics and practitioners on the futility of active management. One of my favorite examples comes from S&P Dow Jones (SPDJ). Their semi-annual S&P Index Versus Active (SPIVA) Scorecard clearly demonstrates the failure of active mutual fund managers to keep up with an appropriate market index. Earlier this month, SPDJ released its updated report evaluating performance through the second half of 2023.
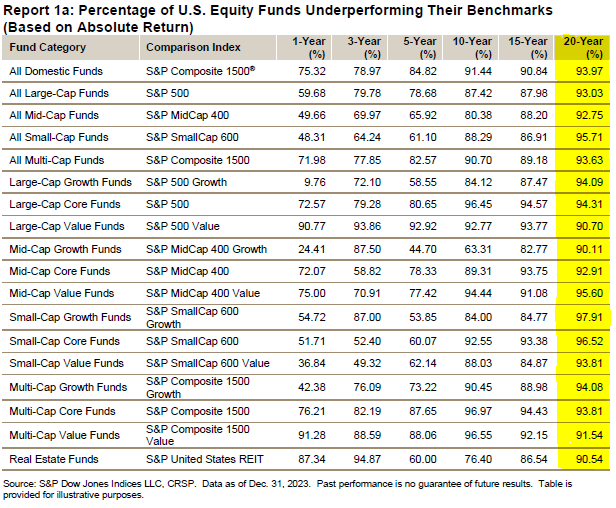
The table below provides a summary of the findings. It separates active domestic equity mutual funds into categories based on their investment mandate, with the performance comparison based on a variety of time horizons. The percentages illustrated represent the portion of active funds that failed to keep up with their relevant benchmark. As you can see in the column highlighted yellow, the overwhelming majority of funds failed to beat the market over the long term.
A few observations from the data:
- The average failure rate across all categories over the 20-year period was a horrendous 93.6%.
- The category that saw the best performance from active managers was mid-cap growth, where only 9.9% of managers were able to keep up with the benchmark.
- The worst-performing category was small-cap growth, where 97.9% of all active managers failed to keep up.
Unfortunately for investors, there was no way to know in advance which of the funds would wind up in the small subset of winners. Furthermore, there is no guarantee that any of the few outperforming funds are capable of repeating that success over the next 20 years.
There are a variety of reasons active stock pickers tend to deliver poor results. First, the stock market is pretty efficient. Stock prices reflect the collective knowledge of all participants. That doesn’t mean prices are always correct, but it does represent the best guess of fair value at any given point in time. To consistently outperform the market, you must consistently have an estimate of fair value that is more accurate than the collective wisdom of all other investors. Second, active managers tend to charge higher fees. This raises the hurdle that must be cleared to deliver superior results.
None of this is to say that investment professionals cannot be leveraged to help people reach their financial goals. Designing an appropriate asset allocation, the mix between riskier equity and more stable fixed-income investments is a critical role that can deliver immense value. The behavioral component is also vital. A financial advisor can help keep emotions at bay, allowing clients to stay the course while other investors become overly optimistic or pessimistic.
Lastly, while market efficiency generally renders active stock-picking useless, there are ways to use the information held in market prices to enhance returns. Decades of empirical research have identified certain stock characteristics that are readily observable in current prices and associated with higher expected returns. These include low price (value), low market capitalization (size), and strong earnings (profitability). Tilting a diversified portfolio toward these characteristics is a way to improve returns without the high cost and guesswork associated with active stock picking.
Week in Review
- The February 2024 CPI data released on March 12th showed that prices rose .4% from the prior month and 3.2% from a year earlier, while Core CPI, which excludes food and energy prices, rose .4% month-over-month and 3.8% year-over-year. With the latest two inflation readings being higher than expected, it is likely that the Federal Reserve will announce tomorrow that it will keep its benchmark interest rate target at the current range of 5.25-5.50%. Investors will be awaiting the release of an updated Summary of Economic Projections (SEP), where they will search for clues on whether the Fed still expects three rate cuts this year.
- The era of negative interest rate policy is over for the time being as the Bank of Japan, the last holdout of negative interest rate policy, increased it’s key policy rate from -0.1% to a range of 0 to 0.1%. While the Bank of Japan raised its key policy rate for the first time since 2007, it also removed its stated target yield on the 10-year Japanese Government bond and halted its purchases of certain assets, specifically stocks, real-estate investment trusts, and corporate bonds.
- The National Association of Realtors announced that it is changing the rules that govern the home sales commission process. This news comes shortly after the association reached a settlement over accusations that the industry conspired to keep agent commissions high. Under the current system, the standard commission is 5-6% of the purchase price (among the highest in the world) and split between the seller’s agent and buyer’s agent, with most home sellers offering to pay the buyer’s agent. Going forward, most buyers will be required to sign agreements outlining how much their agents will be paid, which could save home buyers thousands if the negotiated rates are less than 2.5-3% of the home purchase price.
Hot Reads
Markets
- Consumer Prices Rose 0.4% in February and 3.2% from a Year Ago (CNBC)
- How Has the Fed’s Outlook Changed? Here’s What to Watch Today (WSJ)
- This Week Provided a Reminder That Inflation Isn’t Going Away Anytime Soon (CNBC)
Investing
- Hey Chat GPT, Why Isn’t My AI Fund Up Like NVIDIA? (Jason Zweig)
- So Much Money Everywhere (Ben Carlson)
- How ETTFs Are Created and Redeemed (SSGA)
- Open AI’s New “AGI Robot” STUNS the Entire Industry (YouTube)
- Gordon Ramsay Cooks Up a Simple Steak Dinner with Fries (YouTube)
- It’s Not You: Dating Apps Are Getting Worse (NYT)
Markets at a Glance
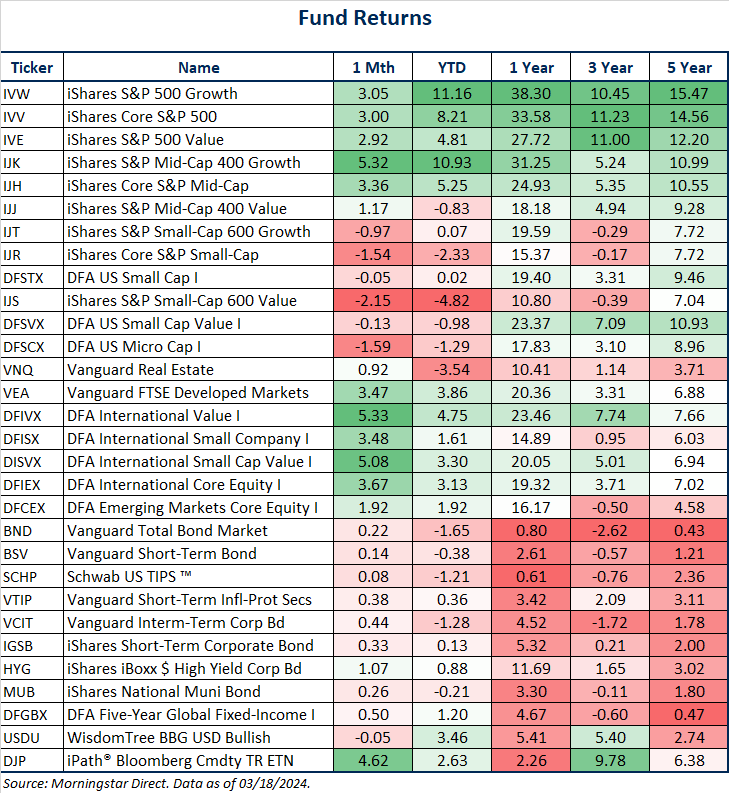
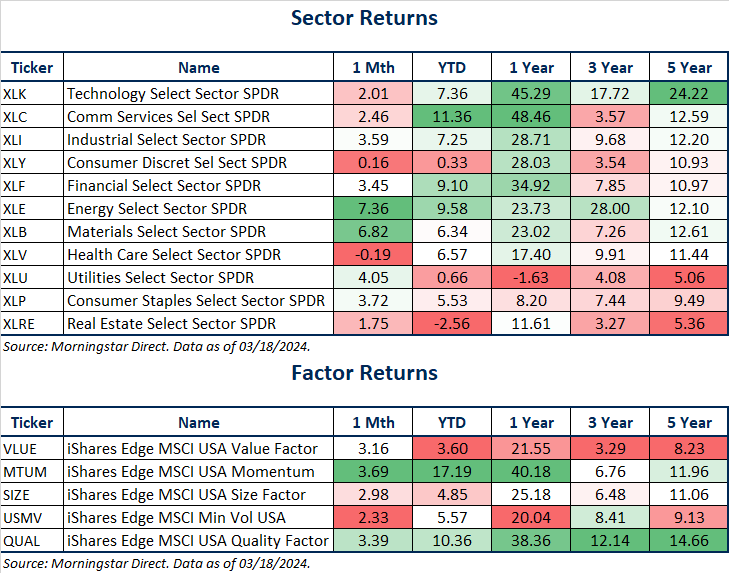
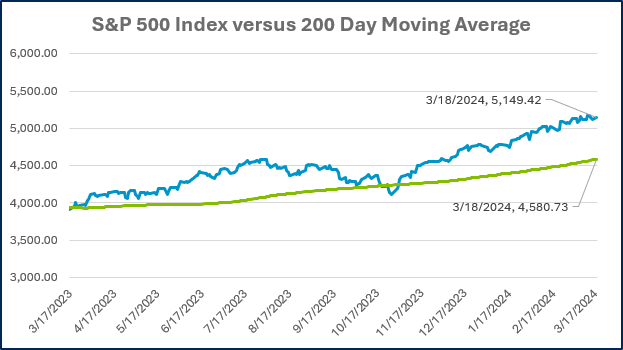
Source: Morningstar Direct.
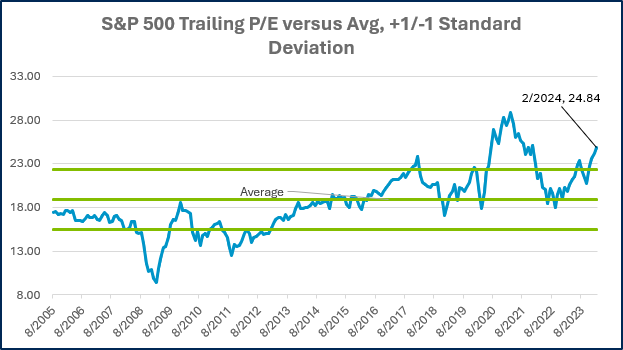
Source: Morningstar Direct.
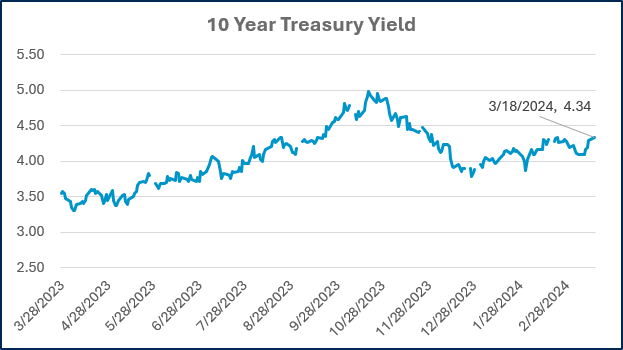
Source: Treasury.gov
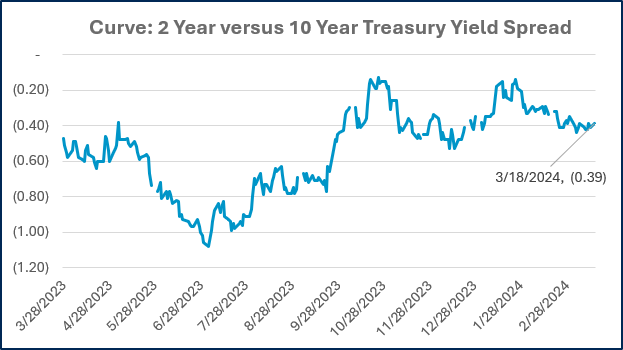
Source: Treasury.gov
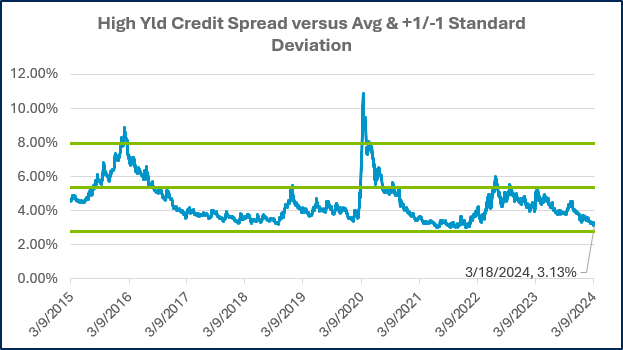
Source: FRED Database & ICE Benchmark Administration Limited (IBA)
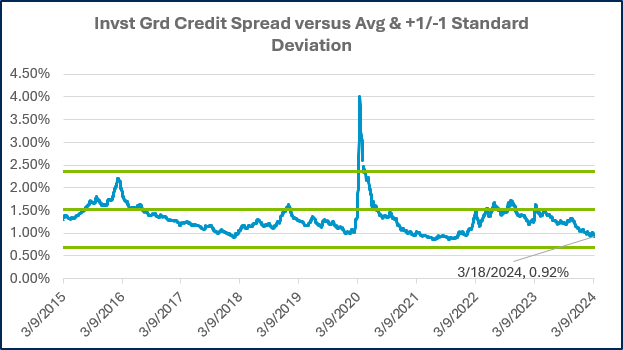
Source: FRED Database & ICE Benchmark Administration Limited (IBA)
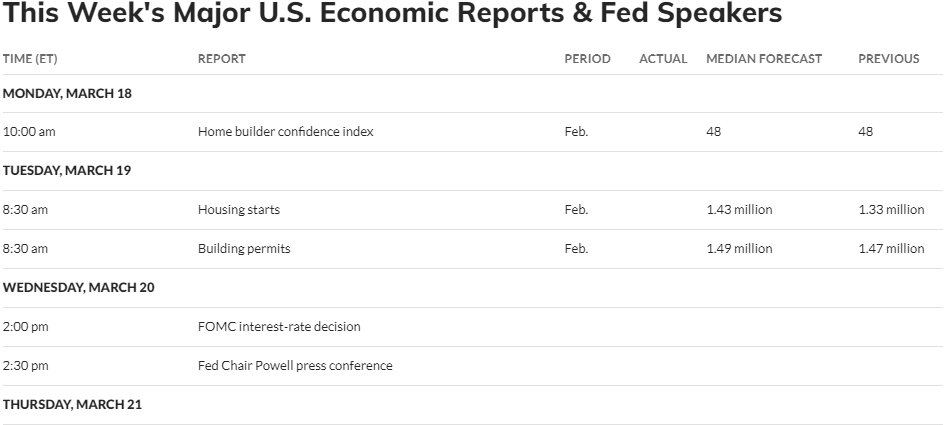
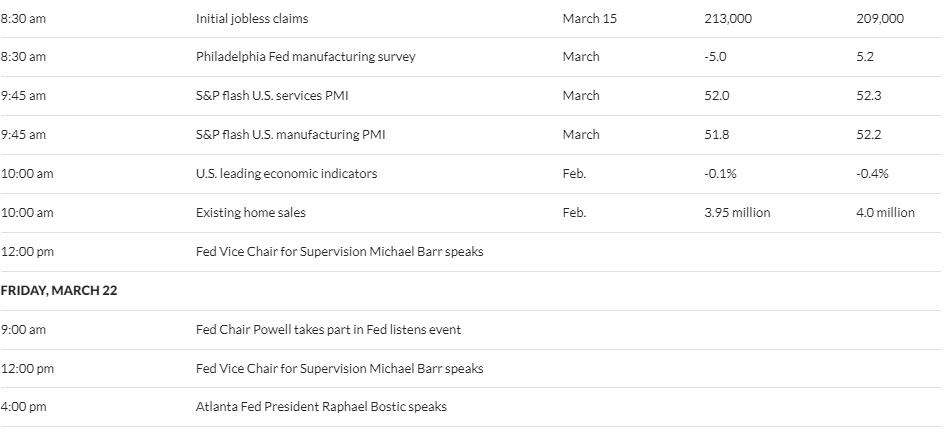
Economic Calendar
Source: MarketWatch

- Competition, Achiever, Relator, Analytical, Ideation
Josh Jenkins, CFA
Josh Jenkins, Chief Investment Officer, began his career in 2010. With a background in investment analysis and portfolio management from his previous roles, he quickly advanced to his current leadership position. As a member of the Lutz Financial Board and Chair of the Investment Committee, he guides Lutz Financial’s investment strategy and helps to manage day-to-day operations.
Leading the investment team, Josh directs research initiatives, while overseeing asset allocation, fund selection, portfolio management, and trading. He authors the weekly Financial Market Update, providing clients with timely insights on market conditions and economic trends. Josh values the analytical nature of his work and the opportunity to collaborate with talented colleagues while continuously expanding his knowledge of the financial markets.
At Lutz, Josh exemplifies the firm’s commitment to maintaining discipline and helping clients navigate market uncertainties with confidence. While staying true to the systematic investment process, he works to keep clients' long-term financial goals at the center of his decision-making.
Josh lives in Omaha, NE. Outside the office, he likes to stay active, travel, and play golf.
Recent News & Insights
Key Individual and Business Tax Changes
Restricted vs. Unrestricted Funds Accounting for Nonprofits
Microsoft 365 Series: Teams Tips & Tricks for Smarter Collaboration
Incorporating Legacy Planning into your Estate Plan


%20(1).jpg?width=300&height=175&name=Mega%20Menu%20Image%20(2)%20(1).jpg)
%20(1)-Mar-08-2024-09-27-14-7268-PM.jpg?width=300&height=175&name=Untitled%20design%20(6)%20(1)-Mar-08-2024-09-27-14-7268-PM.jpg)

%20(1)-Mar-08-2024-09-11-30-0067-PM.jpg?width=300&height=175&name=Untitled%20design%20(3)%20(1)-Mar-08-2024-09-11-30-0067-PM.jpg)
%20(1).jpg?width=300&height=175&name=Mega%20Menu%20Image%20(3)%20(1).jpg)
%20(1).jpg?width=300&height=175&name=Mega%20Menu%20Image%20(4)%20(1).jpg)
%20(1).jpg?width=300&height=175&name=Mega%20Menu%20Image%20(5)%20(1).jpg)
-Mar-08-2024-08-50-35-9527-PM.png?width=300&height=175&name=Untitled%20design%20(1)-Mar-08-2024-08-50-35-9527-PM.png)


.jpg)


