
%20(1)-Mar-08-2024-09-22-41-1011-PM.jpg?width=300&height=175&name=Untitled%20design%20(5)%20(1)-Mar-08-2024-09-22-41-1011-PM.jpg)
%20(1)-Mar-08-2024-09-27-14-7268-PM.jpg?width=300&height=175&name=Untitled%20design%20(6)%20(1)-Mar-08-2024-09-27-14-7268-PM.jpg)

%20(1)-Mar-08-2024-09-11-30-0067-PM.jpg?width=300&height=175&name=Untitled%20design%20(3)%20(1)-Mar-08-2024-09-11-30-0067-PM.jpg)
%20(1)-Mar-08-2024-09-18-53-4361-PM.jpg?width=300&height=175&name=Untitled%20design%20(4)%20(1)-Mar-08-2024-09-18-53-4361-PM.jpg)
-Mar-08-2024-09-03-21-1119-PM.jpg?width=300&height=175&name=Untitled%20design%20(1)-Mar-08-2024-09-03-21-1119-PM.jpg)
-2.png?width=264&height=160&name=Website%20Featured%20Content%20Images%20(1)-2.png)
-Mar-08-2024-08-50-35-9527-PM.png?width=300&height=175&name=Untitled%20design%20(1)-Mar-08-2024-08-50-35-9527-PM.png)


.jpg)


2022 has unquestionably been a tough year for diversified investors. With most major asset classes in the red, there has seemingly been no place to hide. The classic 60-40 portfolio, which represents an asset allocation with 60% invested in stocks and 40% in bonds, is having one of its worst years going back to 1980.
Any time this tried-and-true approach comes under pressure, people tend to line up to declare that it’s dead. Typically, this includes the financial media deploying its standard playbook of using fear to attract eyeballs, as well as other financial professionals trying to sell a more complex (and, of course, more expensive) alternative.
Despite all these declarations, we are not ready to call the time of death yet. Here are three reasons we think the 60-40, or diversified portfolios in general, still make sense for investors.
1. Drawdowns are Normal
The 60-40 portfolio has a very long track record of success, which is part of the reason it gets so much attention when it comes under pressure. The chart below illustrates the annual returns for a 60-40 portfolio going back to 1980. The green bar represents the return contribution from stocks, while the grey bar represents the contribution from bonds. Additionally, the green number represents the total return, while the red number represents the largest intra-year decline.
There are several takeaways from this chart:
- There is a high chance the 60-40 portfolio will have a positive return each year. Since 1980, the portfolio has been positive about 83% of the time (35 of 42 years).
- Typically, if one of the asset classes had a negative year, the other asset class was positive.
- Despite a positive return in most years, intra-year drawdowns are normal and often quite large.
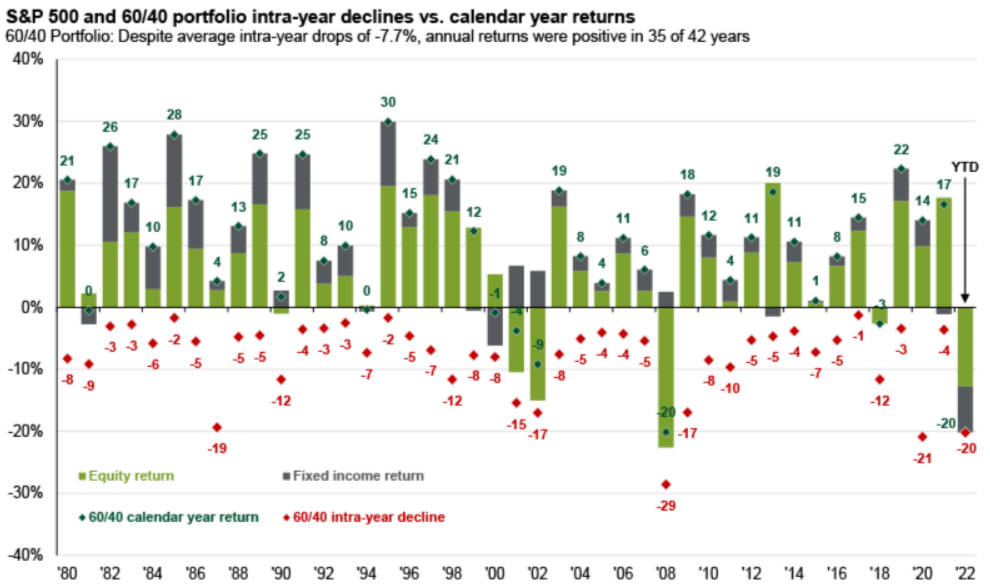
Source: JP Morgan Asset Management, FactSet, Standard & Poor’s, Bloomberg. Intra0year drops refer to the largest market drops from a peak to a trough during the year. For illustrative purposes only. The 60-40 portfolio is 60% invested in the S&P 500 Total Return Index and 40% invested in the Bloomberg U.S. Aggregate Bond Index. The portfolio is rebalanced annually. Returns shown are calendar year returns from 1980 to 2021, over which time period the average annual return was 10.6%. Guide to the Markets – U.S. Data are as of September 30, 2022.
The above chart clearly demonstrates the 60-40 portfolio is not immune to volatility. Prior to 2022, there were ten different instances where the portfolio was down 10% or more during the year. In six of those ten years, the 60-40 still had a positive return. Given the scale of the current drawdown and the relatively short amount of time till the end of the year, it seems unlikely that it will end 2022 in positive territory. Still, we think there are much better days ahead for balanced investors.
2. Valuations Have Improved
Much of the market volatility this year can be attributed to the Federal Reserve’s tightening of monetary policy, which is aimed at combating the rapid pace of inflation. To do this, the Federal Reserve has lifted its benchmark federal funds rate by 3.75%. In the context of recent Fed tightening cycles, the Fed’s actions in 2022 can be considered extremely aggressive. As a result of this dramatic upward shift in short-term interest rates, other asset classes have needed to adjust.
Bond prices move inversely with interest rates, so as rates jumped higher, bond prices plummeted. Making matters worse for the bond market, interest rates have increased from a historically low level. Consequently, there was little to no interest income to offset the price decline. Moving forward, however, things look very different. Now that interest rates have moved dramatically higher, bonds are once again generating income. There is also the possibility that interest rates could decline if the economic outlook got dark enough, this would result in price appreciation for bonds.
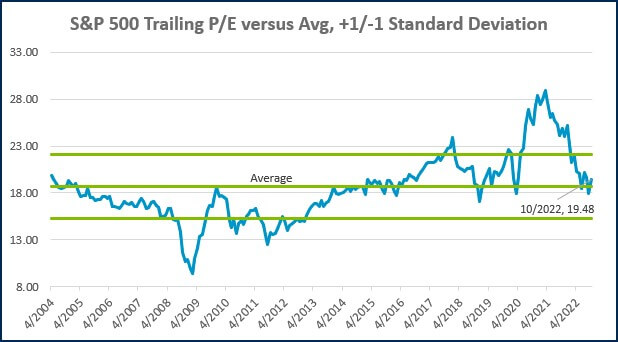
With the yield on the Bloomberg Aggregate Bond Index hovering around 5% as of the end of October, expected returns for the bond market are the highest they have been since the Financial Crisis nearly 15 years ago!
While the relationship of stock prices to the level of interest rates is not as direct as it is for bonds, it is still meaningful. A stock’s value is generally considered to be the present value of all its future cash flows. To arrive at the present value, a discount rate is applied to those cash flows. As interest rates increase, so does the discount rate, which in turn, lowers the present value. Additionally, as interest rates increase, overall demand within the economy slows, which is a headwind to corporate earnings and, ultimately, the cash flow to be returned to shareholders.
By the end of 2021, valuations, particularly for larger growth-oriented companies, were stretched. After the recent volatility we have experienced, prices appear to be much closer to fair value. Some areas of the market, including small, value, and international, are cheaply priced relative to history. Ultimately, while the repricing in both the stock and bond market in response to rising interest rates has been painful, the silver lining is that expected returns have improved dramatically as a result.
3. The Future Remains Uncertain
Investors tend to make poor decisions when sentiment hits an extreme. This is equally true when the market is skyrocketing and the prevailing emotion is greed, as it is when prices are tumbling and fear takes hold. A balanced portfolio, such as the 60-40, is an excellent tool to combat these powerful emotions that can get investors into trouble.
Meaningful exposure to the stock market allows a balanced investor to participate in the upside when times are good, while bonds usually (though not always) provide a ballast to the portfolio, dampening the large swings that can cause investors to sway from their plan.
Elroy Dimson, Professor at the London Business School, famously said: “Risk means more things can happen than will happen.” Inflation, monetary policy, the war in Ukraine, geo-political tensions, slowing economic growth, and other potential risk factors that have not yet been identified can combine to form a virtually limitless array of possible outcomes. As a result, attempting to tactically shift one’s portfolio allocation in anticipation of the future is a fool’s errand. Fortunately, a balanced portfolio relieves an investor of the need to predict the future.
WEEK IN REVIEW
- According to FactSet, 94% of the S&P 500 has reported Q3 results as of November 18th. The earnings growth rate, blended between companies that have already reported with the estimates for those that have yet to report, is at 2.2% year-over-year. If the earnings growth rate for Q3 remains at 2.2%, it will be the slowest quarter of earnings growth in two years. Early estimates for Q4 reflect a 2.1% decline in earnings. Earnings growth represents an important fuel for continued appreciation for the stock market.
- This will be a big week of economic data. On Tuesday, we will get the September reading on the Case-Shiller Home Price Index and consumer confidence. On Wednesday, we will get the first revision on Q3 GDP, job openings, quits, pending home sales, and the Fed’s Beige Book. On Thursday, we will get jobless claims, Personal Consumption Expenditures (PCE – the Fed’s preferred inflation gauge), and manufacturing activity. The week will be headlined by Friday’s Payrolls report.
- Fed Chairmen Jerome Powell is scheduled to give a speech on Wednesday. Investors will tune in and look for any new clues on how monetary policy might evolve in the coming months.
ECONOMIC CALENDAR
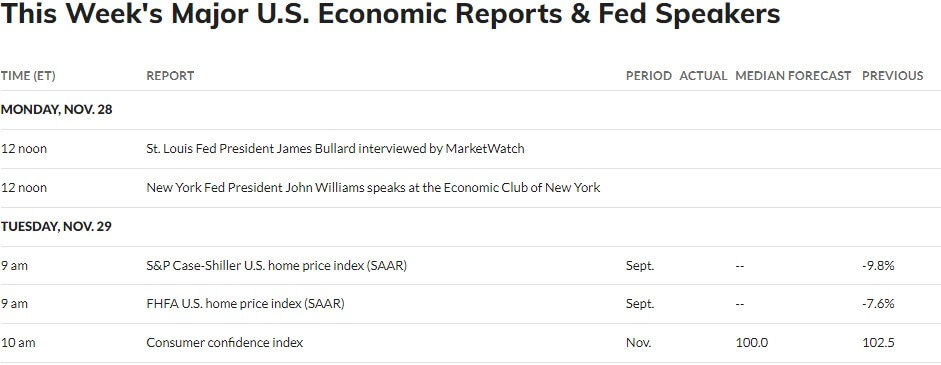
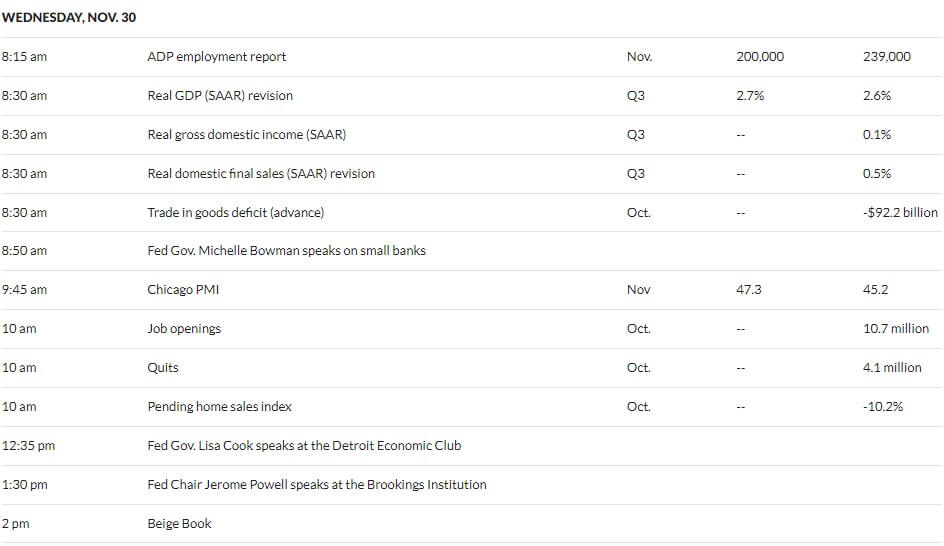
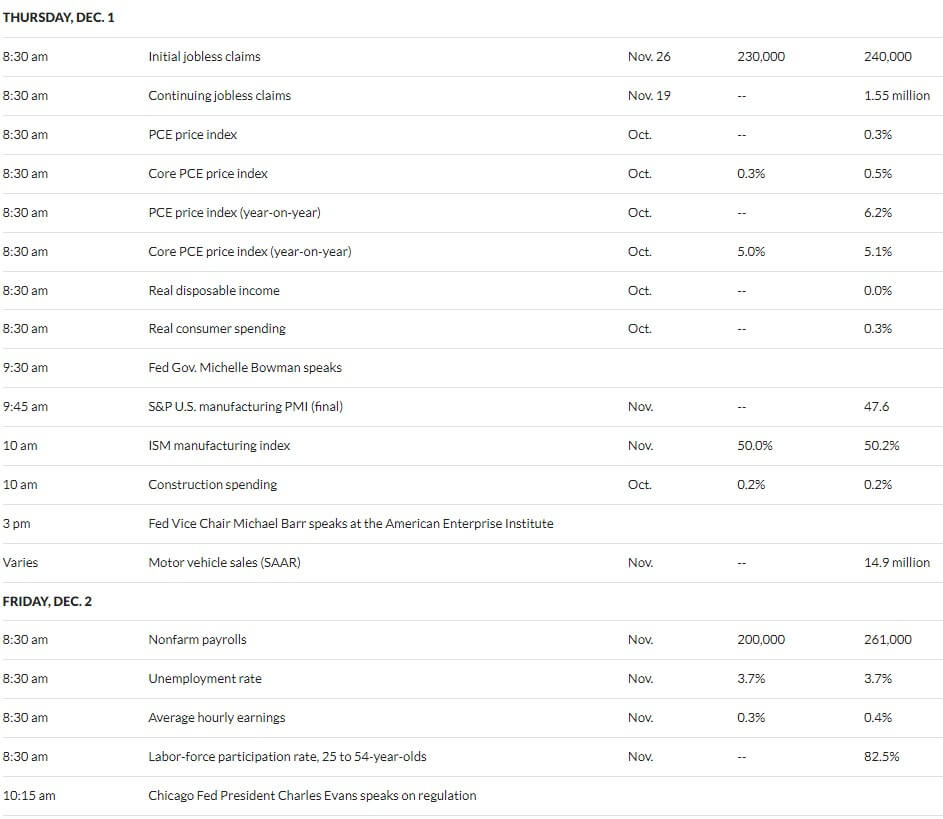
Source: MarketWatch
HOT READS
Markets
- Fed’s Williams Says Inflation Fight Could Last Into 2024 (WSJ)
- Crypto Speculation Is All But Over. Its Systemic Troubles Aren’t (WSJ)
- Yield Curve Inversion Reaches New Extremes (WSJ)
Investing
- What Really Matters (Howard Marks)
- Getting Wealthy vs Staying Wealthy (Morgan Housel)
- Five Reasons for Optimism (Jonathan Clements)
Other
- It’s Not Your Imagination: Shopping on Amazon Has Gotten Worse (Washington Post)
- Nebraska Hires Matt Rhule: What We Know, and What we Don’t, About New Coach (The Athletic)
- The U.S. Needs More Housing Than Almost Anyone Can Imagine (The Atlantic)
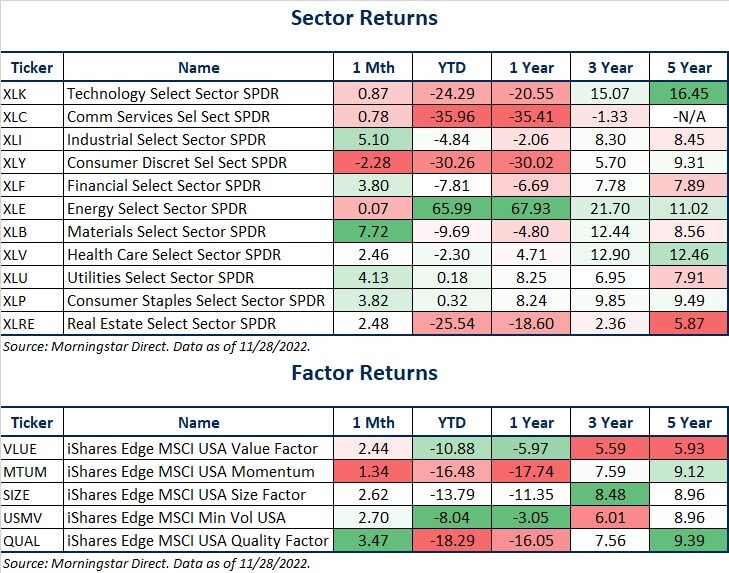
MARKETS AT A GLANCE
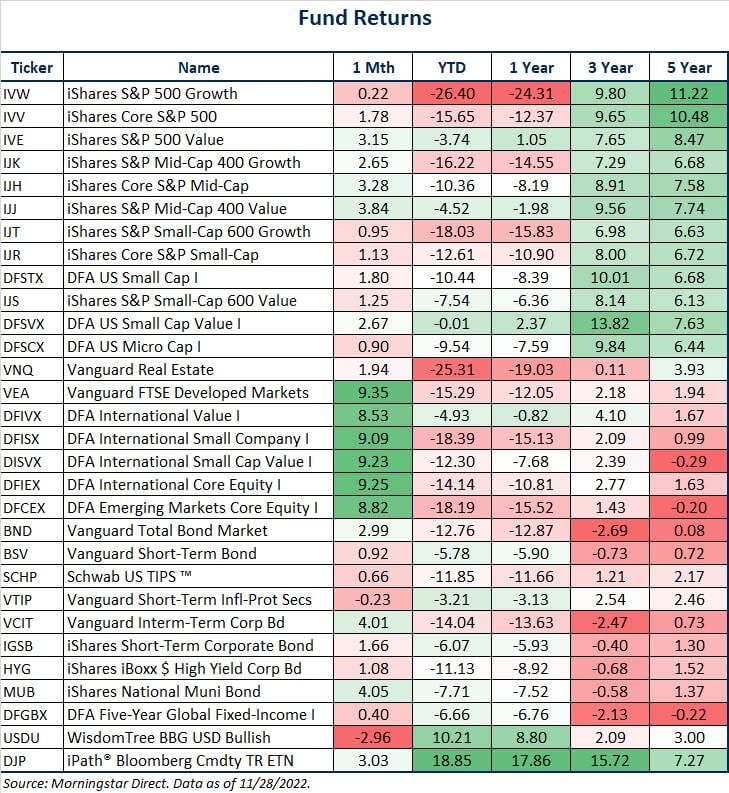
Source: Morningstar Direct.
Source: Morningstar Direct.
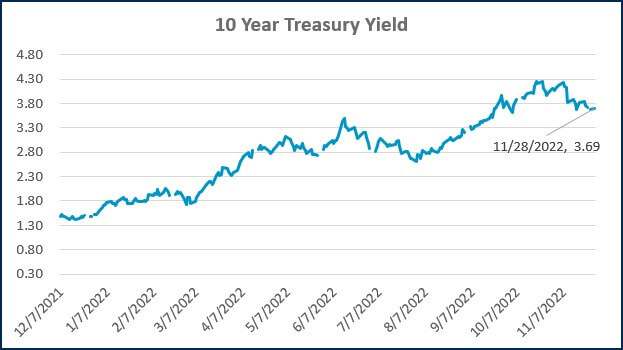
Source: Treasury.gov
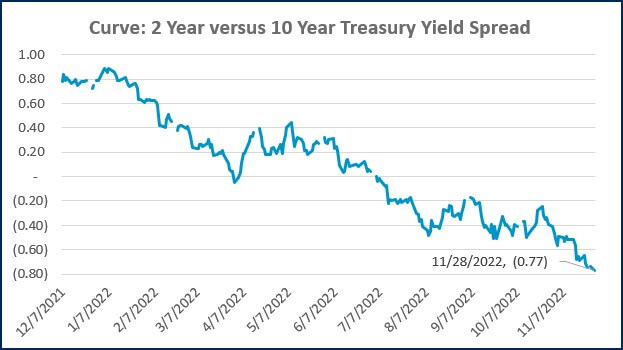
Source: Treasury.gov
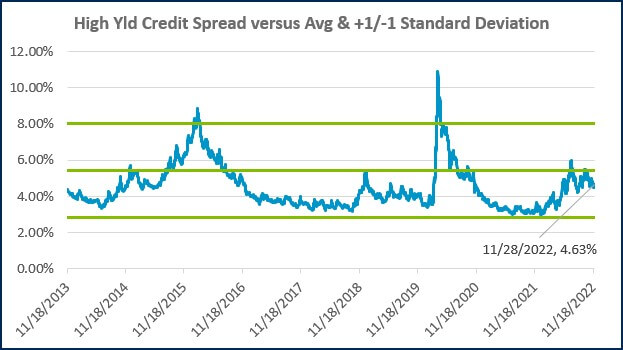
Source: FRED Database & ICE Benchmark Administration Limited (IBA)
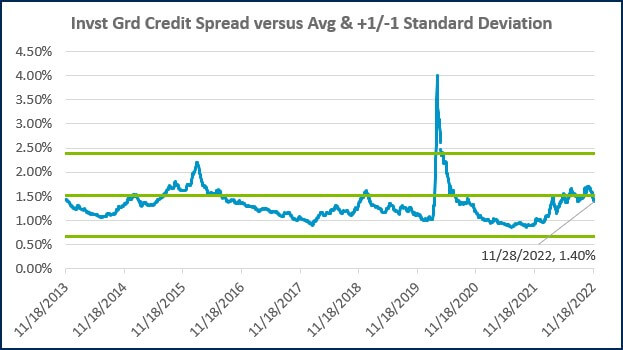
Source: FRED Database & ICE Benchmark Administration Limited (IBA)

- Competition, Achiever, Relator, Analytical, Ideation
Josh Jenkins, CFA
Recent News & Insights

How to Prepare for a Financial Statement Audit

Are You Prepared? Financial Access Checklist for Spouses

Are AI Stocks in Trouble? + 1.29.25

Intra-Family Loans to Help a Family Member Purchase a Home

