
%20(1)-Mar-08-2024-09-22-41-1011-PM.jpg?width=300&height=175&name=Untitled%20design%20(5)%20(1)-Mar-08-2024-09-22-41-1011-PM.jpg)
%20(1)-Mar-08-2024-09-27-14-7268-PM.jpg?width=300&height=175&name=Untitled%20design%20(6)%20(1)-Mar-08-2024-09-27-14-7268-PM.jpg)

%20(1)-Mar-08-2024-09-11-30-0067-PM.jpg?width=300&height=175&name=Untitled%20design%20(3)%20(1)-Mar-08-2024-09-11-30-0067-PM.jpg)
%20(1)-Mar-08-2024-09-18-53-4361-PM.jpg?width=300&height=175&name=Untitled%20design%20(4)%20(1)-Mar-08-2024-09-18-53-4361-PM.jpg)
-Mar-08-2024-09-03-21-1119-PM.jpg?width=300&height=175&name=Untitled%20design%20(1)-Mar-08-2024-09-03-21-1119-PM.jpg)
-2.png?width=264&height=160&name=Website%20Featured%20Content%20Images%20(1)-2.png)
-Mar-08-2024-08-50-35-9527-PM.png?width=300&height=175&name=Untitled%20design%20(1)-Mar-08-2024-08-50-35-9527-PM.png)


.jpg)


The federal government appeared to be heading towards a shutdown in late September until a last-second push by Congress successfully kicked the can down the road. The government now has funding through November 17th but still needs to arrive at a longer-term solution. With the House of Representatives focused on electing a new Speaker, the clock is ticking, and it again appears like a shutdown is a real possibility. If this were to occur, what impact would it have on the economy and investors?
Before we get to the implications, it may be worth highlighting the difference between the debt ceiling debate that occurred earlier this year and the current discussion aimed at keeping the government operating.
- The debt ceiling is a statutory cap on the amount the government can borrow to pay for spending previously approved by Congress. A failure to raise the debt ceiling would result in the government defaulting on its debt, which would have unknown but likely severe negative consequences for the global financial system.
- A government shutdown occurs when Congress fails to approve spending for a new fiscal year. Approximately 25% of the Federal budget is approved annually via a series of 12 appropriations bills. Failure to pass these bills forces government agencies to cease non-essential activities until Congress acts.
In the event of a shutdown, essential functions, which include the military, law enforcement, mail delivery, air traffic control, and others, continue to operate. Other non-essential employees are furloughed. Most government employees will not receive pay, regardless of whether they have been furloughed or not. Historically, these workers have recouped those wages after the conclusion of the shutdown. As a result, the impact on overall economic activity has generally been benign. Much of the missed activity during past shutdowns has come in the form of a delay as opposed to a permanent loss.
The chart below from Vanguard illustrates years where there has been a shutdown. In total, there have been 21 occurrences since 1976, which equates to a shutdown in one out of three years1. That may be a higher frequency than many people would have guessed. The market has generally taken these episodes in stride. Stocks delivered a positive return in just over half of the shutdowns, while the average return has been a positive 0.1%. The key takeaway here is that there is no obvious relationship between past government lockdowns and market performance.
Standard & Poor’s 500 Index Price Return During U.S. Government Shutdowns
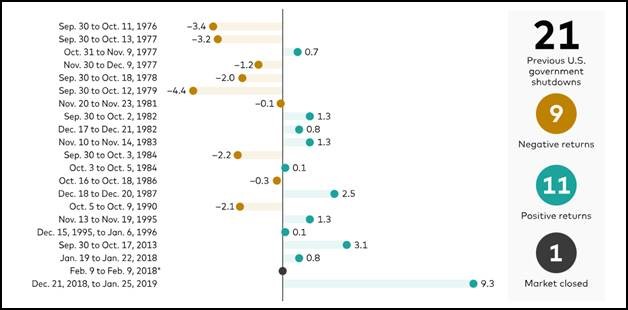
Note: The Feb 9 shutdown occurred overnight, and an agreement was reached before the market opened. Source: Vanguard calculations, based on data from FactSet and the Congressional Research Service. Past performance is no guarantee of future returns.
Shutdowns can be very disruptive for government employees and serve as an inconvenience for other Americans. The market hates uncertainty, and we may very well see an uptick in volatility as negotiations heat up. A new spending bill will ultimately be passed, however, which has typically led to workers receiving back pay. This has mitigated the economic and investment impact in the past. For long-term investors, the budget saga represents noise that should be ignored.
1. Some years have experienced multiple government shutdowns.Week in Review
- CBRE, one of the larger commercial real estate services and investment firms, recently released an analysis comparing the cost of buying a new home vs. renting. They found that the average new monthly mortgage payment is 52% higher than the cost of renting, which is the most extreme level since 1996.
- Applications for unemployment benefits in the U.S. fell by 13,000 to 198,000 for the week ending October 14th, which is the lowest level in nine months. At the state level, 45 of the 53 states/territories that report these figures to the federal government saw initial jobless claims fall, while just eight states reported that claims rose.
- According to FactSet, 17% of the S&P 500 has reported Q3 results as of last Friday (10/20). The earnings growth rate, blended between companies that have already reported with the estimates for those that have yet to report, is at -0.4% year-over-year. Expectations for the earnings growth rate at the onset of earnings season was -0.3% year-over-year. If the blended-rate estimate comes to fruition, it will mark the fourth consecutive quarter of negative year-over-year earnings growth for the S&P 500.
Hot Reads
Markets
- Jerome Powell Signals Fed Will Extend Interest-Rate Pause (WSJ)
- There’s Never Been a Worse Time to Buy Instead of Rent (WSJ)
Investing
- Dollars Are for Spending & Investing, Not Saving (Barry Ritholtz)
- Americans Have Never Been Wealthier & No One is Happy (Ben Carlson)
- The Thin Line Between Bold and Reckless (Morgan Housel)
Other
- Are You Good Enough to Play College Golf (Golf Digest)
- “Five Eyes” Intelligence Leaders Warn Of China’s Global Espionage Campaign – 60 Minutes (YouTube)
- Casual Dining Chains Are Back, Baby (Eater)
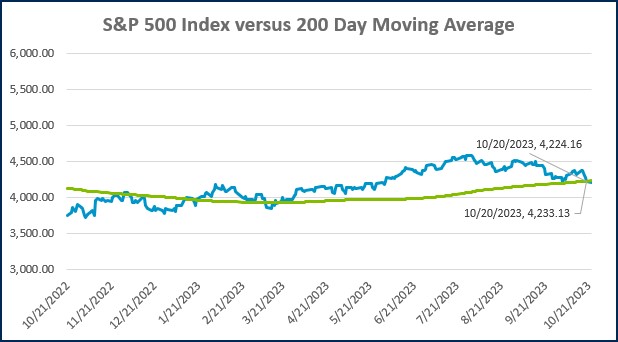
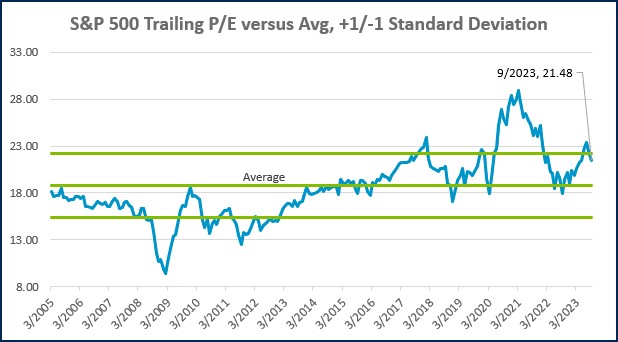
Markets at a Glance
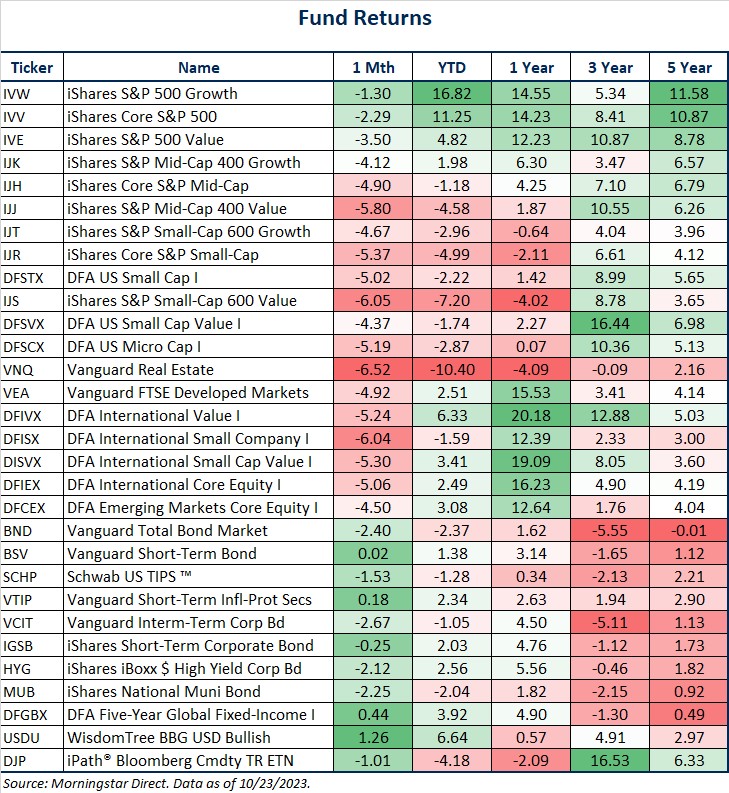

Source: Morningstar Direct.
Source: Morningstar Direct.
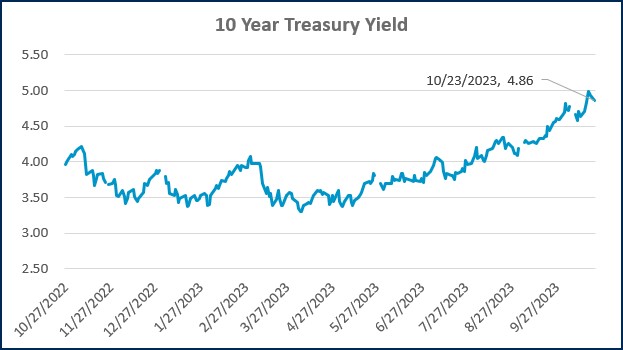
Source: Treasury.gov
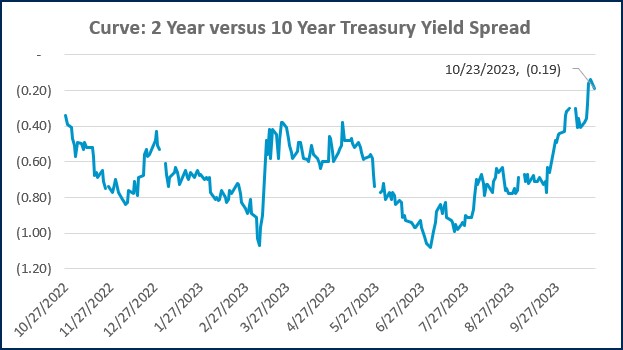
Source: Treasury.gov
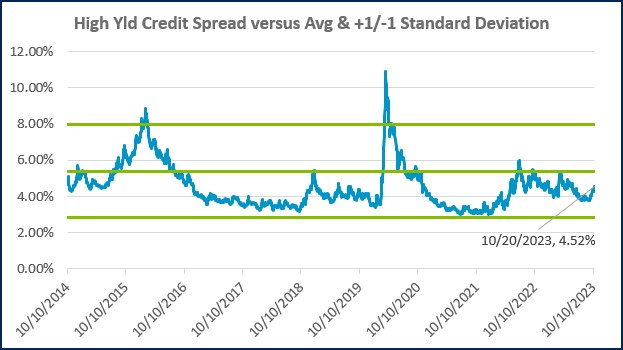
Source: FRED Database & ICE Benchmark Administration Limited (IBA)
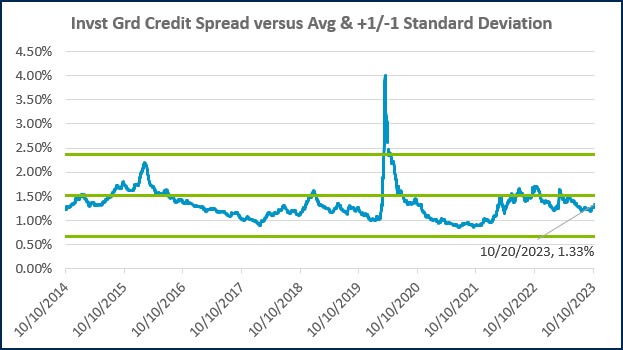
Source: FRED Database & ICE Benchmark Administration Limited (IBA)
Economic Calendar
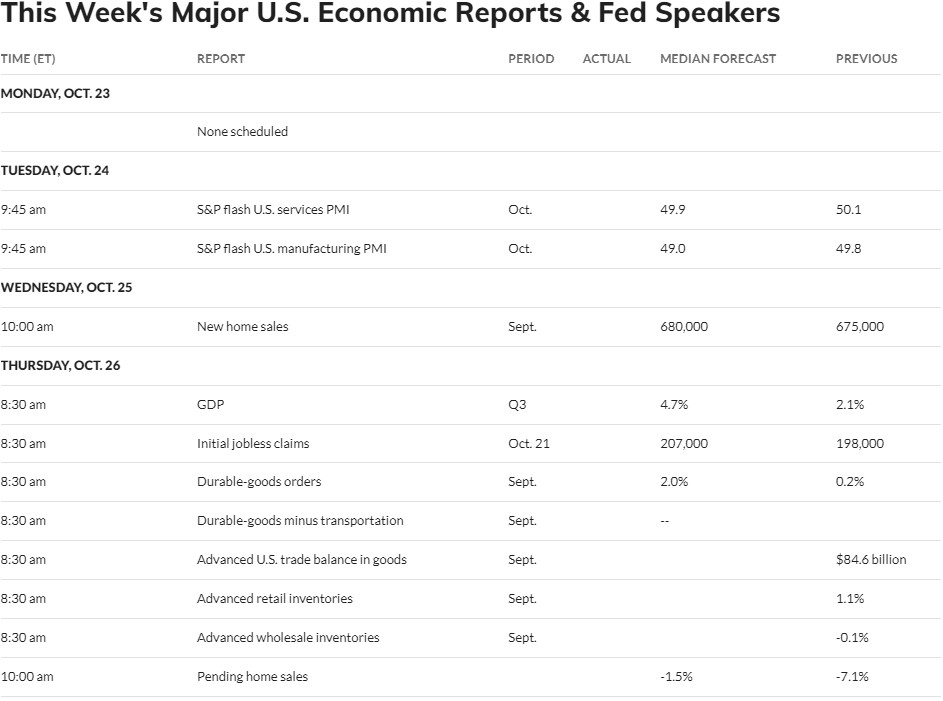
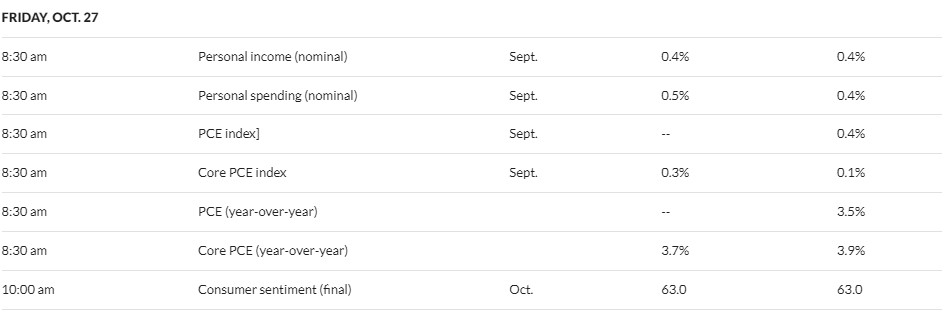
Source: MarketWatch

- Competition, Achiever, Relator, Analytical, Ideation
Josh Jenkins, CFA
Chief Investment Officer, Principal
Josh Jenkins is a Chief Investment Officer and Principal at Lutz Financial. He began his career in 2010. Josh leads the Investment Committee and specializes in assisting clients with portfolio construction, asset allocation, and investment risk management. He is also responsible for portfolio trading, research and thought leadership, and the division's analytics and operational efficiency. He lives in Omaha, NE.
Recent News & Insights

Accounting
How to Prepare for a Financial Statement Audit
Getting ready for an audit can feel daunting - from gathering countless documents to ensuring ...

Accounting
Are You Prepared? Financial Access Checklist for Spouses
Do you or your spouse handle most of your financial activities? If your spouse were not here ...

Market Commentary
Are AI Stocks in Trouble? + 1.29.25
The market had a rocky start to the week as the artificial intelligence (AI) industry ...

Financial Planning
Intra-Family Loans to Help a Family Member Purchase a Home
The Current Housing Market Challenge It has been well documented over recent years that it has ...


Let’s get you where you want to go.
We work to simplify complexities, help make critical business decisions, and confidently focus on the things that are truly important to you. We embrace your business as our own to spark the right solutions and help you thrive.