.jpg?width=300&height=175&name=Mega%20Menu%20Image%20(1).jpg)
%20(1).jpg?width=300&height=175&name=Mega%20Menu%20Image%20(2)%20(1).jpg)
%20(1)-Mar-08-2024-09-27-14-7268-PM.jpg?width=300&height=175&name=Untitled%20design%20(6)%20(1)-Mar-08-2024-09-27-14-7268-PM.jpg)

%20(1)-Mar-08-2024-09-11-30-0067-PM.jpg?width=300&height=175&name=Untitled%20design%20(3)%20(1)-Mar-08-2024-09-11-30-0067-PM.jpg)
%20(1).jpg?width=300&height=175&name=Mega%20Menu%20Image%20(3)%20(1).jpg)
%20(1).jpg?width=300&height=175&name=Mega%20Menu%20Image%20(4)%20(1).jpg)
%20(1).jpg?width=300&height=175&name=Mega%20Menu%20Image%20(5)%20(1).jpg)
-Mar-08-2024-08-50-35-9527-PM.png?width=300&height=175&name=Untitled%20design%20(1)-Mar-08-2024-08-50-35-9527-PM.png)


.jpg)


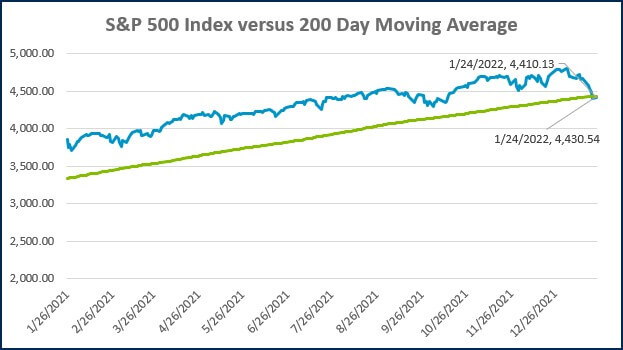
The trading session to start this week was especially choppy. The S&P 500 had an intraday decline of as much as 4% on Monday before rallying and finishing the day slightly positive. Near the lows of the day, the index briefly joined the technology-heavy Nasdaq Composite in a technical correction(1). At one point during the day, the S&P 500 was on pace for its worst start to a year ever, with the year-to-date return falling as low as -11.4%.
When stocks dip the way they have in recent weeks, investors tend to get jittery. This can be seen in sentiment data, with some measures showing individual investors have their most pessimistic outlook for stocks since the middle of 2020(2). During periods like this, it is important for investors to remember that volatility is a normal feature of the stock market and does not need to be feared.
Selloffs like the one we are experiencing, and even much larger ones, occur regularly. With valuations currently stretched, a price decline can be a healthy way to clear some froth out of the marketplace. Additionally, the economy has been growing at a solid clip, and earnings for the most recent quarter are again expected to be strong. Allowing business fundamentals to catch up to stock prices is a way to set the market up for sustainable appreciation moving forward.
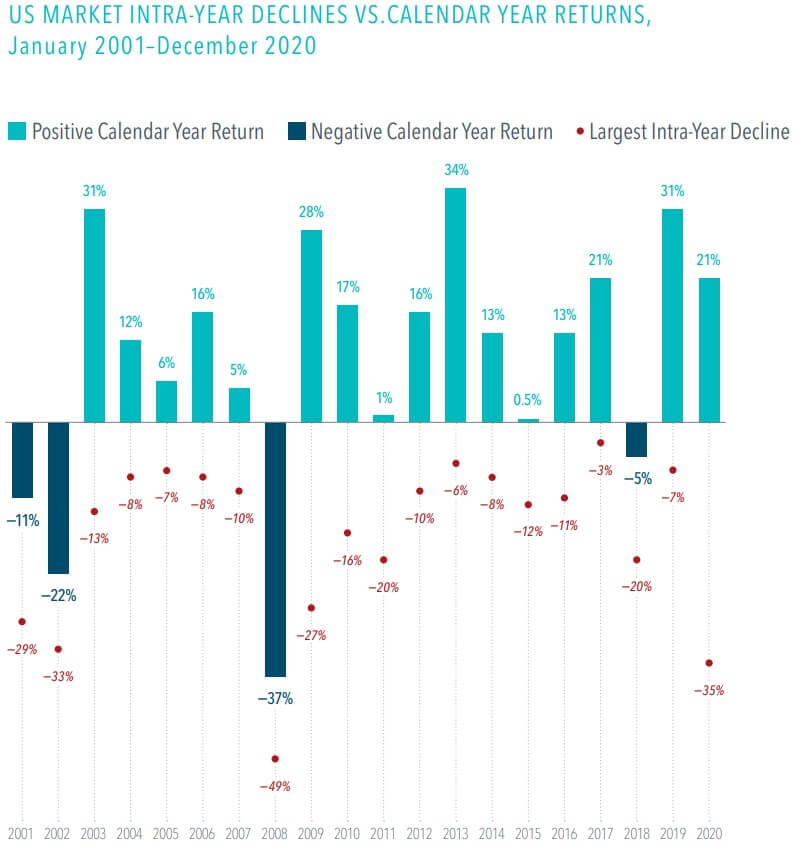
The chart below from Dimensional Fund Advisors (DFA) illustrates the regularity of stock selloffs. In the twenty years between 2001 and 2020, there was only one year where the S&P 500 was not down at least 5% at some point. A few other observations from the chart:
- Over half of the years (13/20) experienced a correction (> 10% loss)
- Nearly half of the years (7/20) experienced a bear market (> 20% loss)
- Even the best years for the stock market came with sizable intra-year declines
 Source: Dimensional Fund Advisors (DFA)
Despite all of those intra-year selloffs, the market returned 322% over the full period. If we included 2021, the cumulative return would jump to 444%. Diversified investors that were chased out of the market by volatility may have missed out on a tremendous wealth-building opportunity.
1. A correction generally refers to a price decline of at least 10%.
2. According to the American Association of Individual Investors (AAII) Sentiment Survey
WEEK IN REVIEW
- Earnings growth for the fourth quarter was projected at 21.4% YoY as of the end of December, according to FactSet. With 4% of S&P 500 companies having reported, the blended growth rate estimate (incorporating actual results where applicable) has increased to 21.8%.
- All eyes will be on the year’s first Federal Reserve meeting that concludes this Wednesday. The market is not expecting the first rate hike to occur until the March meeting, but investors will parse the post-meeting statement and press conference for clues on the expected timing and pace of hikes that are coming this year.
- Aside from the Fed announcement and press conference with Chair Powell on Wednesday, look for Jobless claims, durable goods orders, and the first estimate of Q4 GDP on Thursday. On Friday, we will get another look at December inflation with the Fed’s preferred gauge: the Personal Consumption Expenditures (PCE).
ECONOMIC CALENDAR
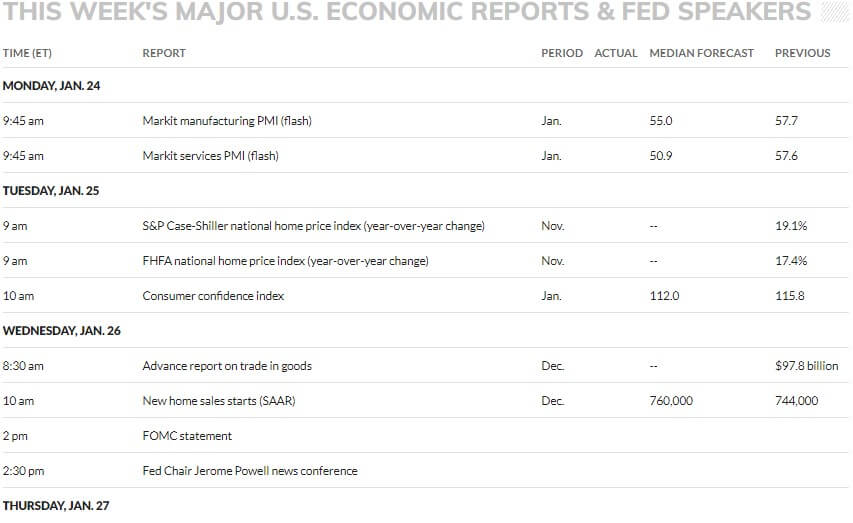
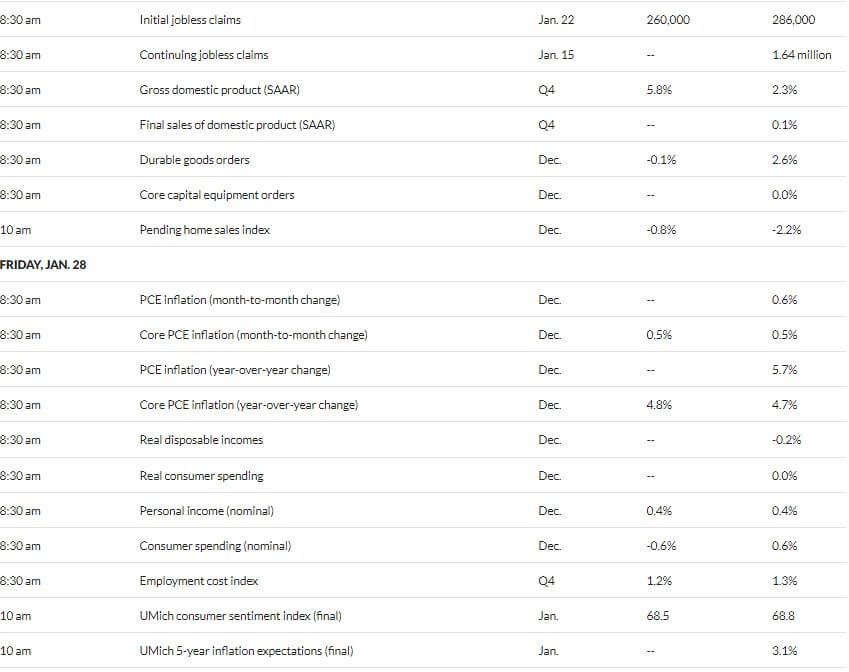
Source: MarketWatch
HOT READS
Markets
- Inflation Poses Risks of Faster, Less Predictable Fed Rate Increases (WSJ)
- The Fed is About to See a Lot of New Faces. What it Means for Banks, the Economy and Markets (CNBC)
- The Fed is Likely to Signal a March Interest Rate Hike and that Further Policy Tightening is Coming (CNBC)
Investing
- Why Bond Yields Are a Key barometer of the Economy (WSJ)
- Casualties of Your Own Success (Morgan Housel)
- When does it make sense to sell? (Howard Marks)
Other
- Integrity Still Matters for the Hall of Fame (SI)
- The James Webb Space Telescope Could Solve One of Cosmology’s Deepest Mysteries (SA)
- The Best veterinary Telemedicine Services (Wired)
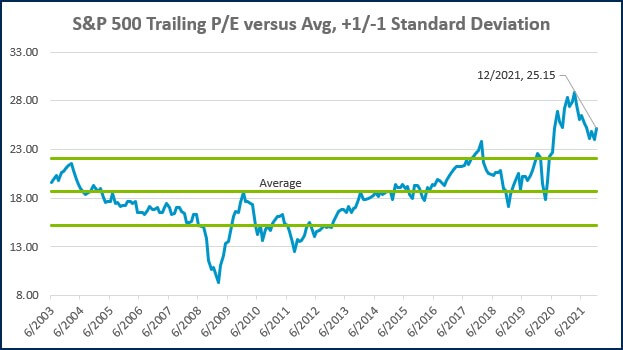
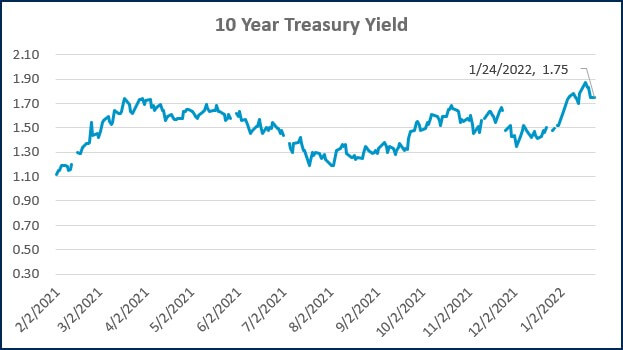
MARKETS AT A GLANCE
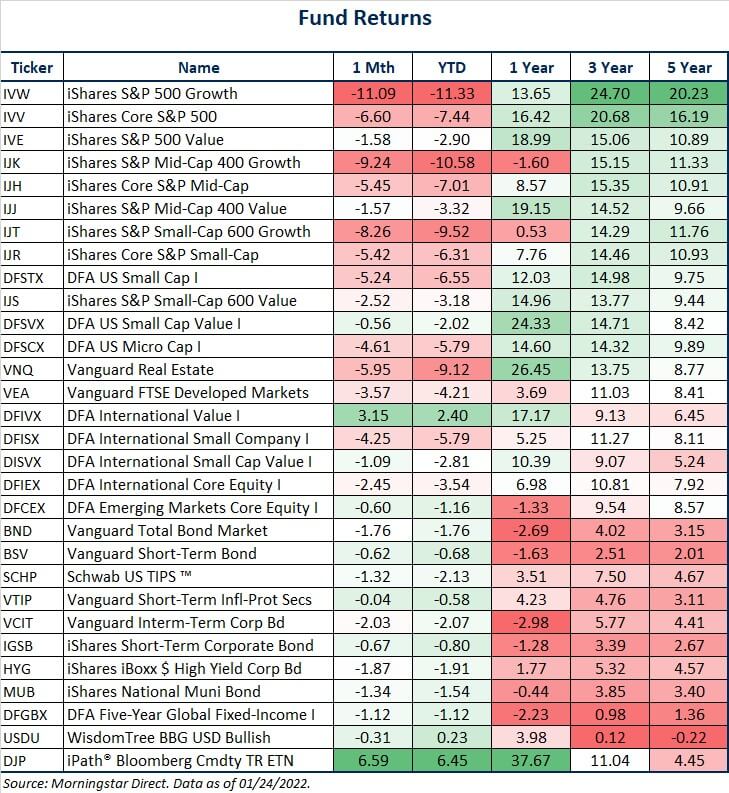
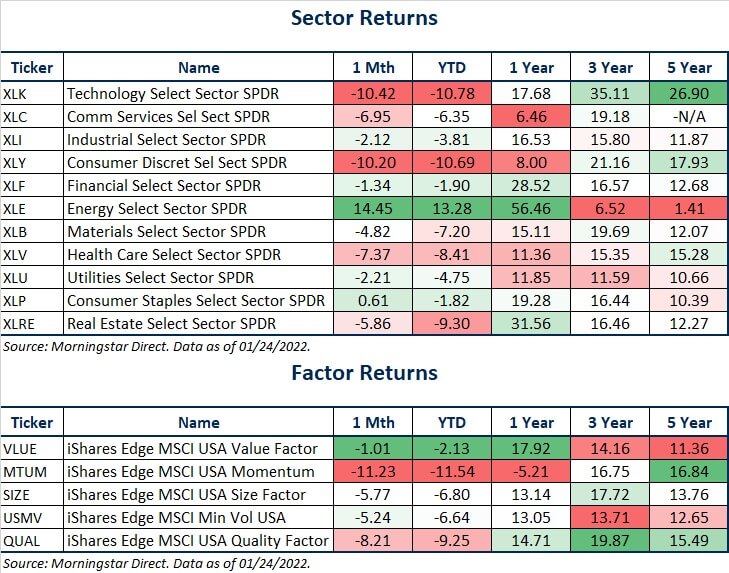
Source: Morningstar Direct.
Source: Morningstar Direct.
Source: Treasury.gov
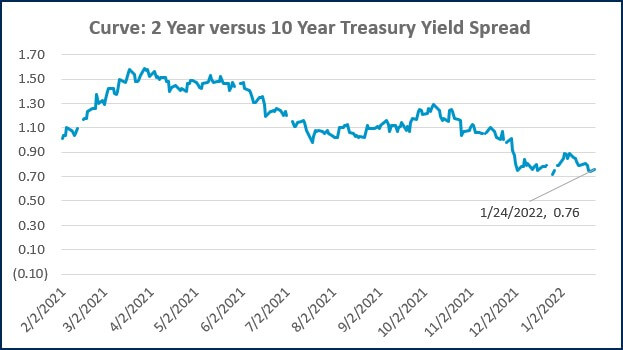
Source: Treasury.gov
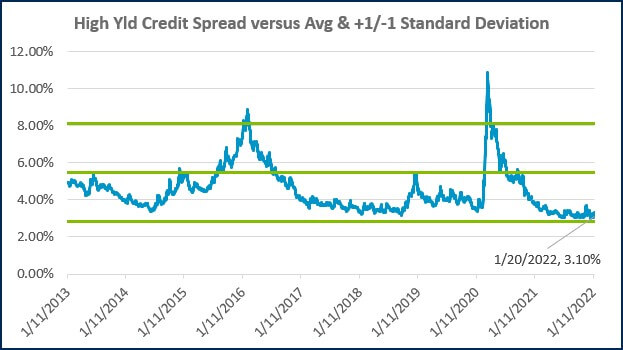
Source: FRED Database & ICE Benchmark Administration Limited (IBA)
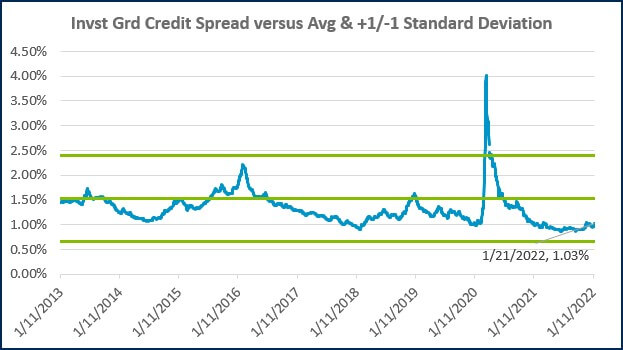
Source: FRED Database & ICE Benchmark Administration Limited (IBA)

- Competition, Achiever, Relator, Analytical, Ideation
Josh Jenkins, CFA
Josh Jenkins, Chief Investment Officer, began his career in 2010. With a background in investment analysis and portfolio management from his previous roles, he quickly advanced to his current leadership position. As a member of the Lutz Financial Board and Chair of the Investment Committee, he guides Lutz Financial’s investment strategy and helps to manage day-to-day operations.
Leading the investment team, Josh directs research initiatives, while overseeing asset allocation, fund selection, portfolio management, and trading. He authors the weekly Financial Market Update, providing clients with timely insights on market conditions and economic trends. Josh values the analytical nature of his work and the opportunity to collaborate with talented colleagues while continuously expanding his knowledge of the financial markets.
At Lutz, Josh exemplifies the firm’s commitment to maintaining discipline and helping clients navigate market uncertainties with confidence. While staying true to the systematic investment process, he works to keep clients' long-term financial goals at the center of his decision-making.
Josh lives in Omaha, NE. Outside the office, he likes to stay active, travel, and play golf.
Recent News & Insights

Financial Planning Advice for Recent College Grads

2024’s Hot Stocks Have Cooled Fast + 4.23.25

Do You Need a Family Office? 7 Aspects to Consider

Tariff Volatility + 4.7.25

