
%20(1)-Mar-08-2024-09-22-41-1011-PM.jpg?width=300&height=175&name=Untitled%20design%20(5)%20(1)-Mar-08-2024-09-22-41-1011-PM.jpg)
%20(1)-Mar-08-2024-09-27-14-7268-PM.jpg?width=300&height=175&name=Untitled%20design%20(6)%20(1)-Mar-08-2024-09-27-14-7268-PM.jpg)

%20(1)-Mar-08-2024-09-11-30-0067-PM.jpg?width=300&height=175&name=Untitled%20design%20(3)%20(1)-Mar-08-2024-09-11-30-0067-PM.jpg)
%20(1)-Mar-08-2024-09-18-53-4361-PM.jpg?width=300&height=175&name=Untitled%20design%20(4)%20(1)-Mar-08-2024-09-18-53-4361-PM.jpg)
-Mar-08-2024-09-03-21-1119-PM.jpg?width=300&height=175&name=Untitled%20design%20(1)-Mar-08-2024-09-03-21-1119-PM.jpg)
-2.png?width=264&height=160&name=Website%20Featured%20Content%20Images%20(1)-2.png)
-Mar-08-2024-08-50-35-9527-PM.png?width=300&height=175&name=Untitled%20design%20(1)-Mar-08-2024-08-50-35-9527-PM.png)


.jpg)


The stock market has shown considerable momentum in recent months, culminating last week in a new all-time high for the large-cap stocks of the S&P 500 Index. This milestone marks the end of the bear market, typically defined as a decline of 20% or more, that began in January 2022.
The chart below provides a high-level view of the bear market decline and subsequent recovery. Take special note of the way expectations tend to move prices ahead of actual events.
The bear market began in January 2022 as the Federal Reserve foreshadowed its intent to rapidly tighten monetary policy to combat inflation. At one point, the market’s decline reached -13% before the Fed’s first hike in March 2022. The prevailing view was that the economy would enter a recession because of the Fed’s actions, and the market wasted no time incorporating this expectation into prices.
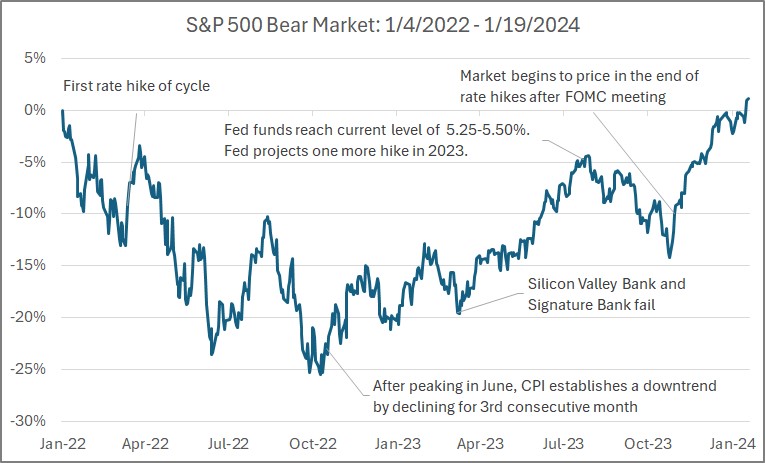
Source: Morningstar Direct. Chart reflects total returns for the S&P 500 between 1/1/2022 and 1/22/2024.
The market hates uncertainty. One thing that was highly uncertain in 2022 was just how bad inflation might get. The Consumer Price Index (CPI), a popular inflation measure, peaked in June at 9.1% year-over-year. In October, however, CPI data had revealed three consecutive months of decline. This provided hope that the Fed was making steady progress toward its goal of restoring price stability. Even though the Fed would go on to hike rates by an additional 2.0% between October 2022 and July 2023, the market’s expectation of cooling inflation ignited the market’s recovery.
For the most part, inflation continued to cool over the following 12 months while the economy remained surprisingly resilient. Strong consumer demand and a robust labor market provided a counterbalance to weak manufacturing and housing activity. This isn’t to say there were no bumps in the road. March of 2023, in particular, created some fireworks as regional banks confronted solvency issues due to balance sheets impaired by sharply higher interest rates and rapid deposit outflows. This episode culminated in some of the largest bank failures in US history. However, a few stop-gap measures enacted by the Federal Reserve and FDIC managed to keep the problem from spreading any further.
Late in 2023, continued economic resilience in the face of declining inflation pressure led the market to anticipate a so-called ‘soft landing,’ where the Fed successfully restored price stability without pushing the economy into a recession. The view that the Fed was not only done hiking rates but may need to begin cutting in early to mid-2024 generated a sharp rally in the final two months of the year. This gave the market the last bit of fuel it needed to push to a new all-time high.
It’s important to remember that both bear markets and all-time highs are normal parts of the market cycle. Fortunately, all-time highs occur much more frequently than bear markets!
By the numbers, S&P 500 Index highs since 1950:
- Since 1950, the S&P 500 has closed at a new high 1,474 times.
- It has averaged about 20 new closing highs per year.
- Roughly 2/3rds of years have had at least one new high.
- A new high has occurred roughly 8% of the days the market has been open.
S&P 500 Index Bear Markets since 1950:
- There have been 11 bear markets since 1950, roughly one every 6.5 years.
- The average market decline has been about -35%.
- The average length (peak to trough) has been 381 days.
- The average time from the start of a bear market to a new all-time high has been 1,128 days.
- In this recent bear market, it took 282 days to go from peak to trough and 746 days to go from peak to trough back to a new peak.
The value of stocks generally trends higher, though that progress is not steady. The frequent gyrations and dips represent a major reason why a diversified portfolio of stocks typically carries a higher expected return relative to a ‘safe’ asset like cash. The stock market would be unable to attract any investors if cash offered similar expected returns. The stock market must instead offer a premium to entice people.
The chart below illustrates the S&P 500 Index level over the last 75 years. It provides a simple visual of the relentless march higher in the value of the stock market and the near-constant gyrations that make it anything but a perfectly smooth ride. Ultimately, an investor’s willingness and ability to stomach those gyrations is what allows them to take advantage of one of the best wealth-creating machines in history.
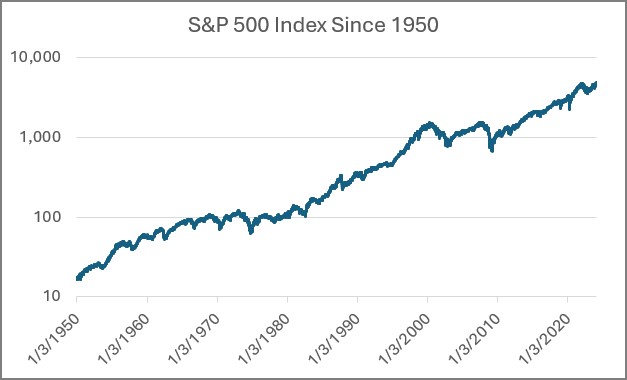
Source: Morningstar Direct. S&P 500 Index level from 1/1/1950 to 1/22/2024. Chart uses a logarithmic scale.
Week in Review
- The National Association of Realtors released its annual existing home sales data last Friday, showing existing home sales of 4.09 million in 2023. This reading was down 19% from 2022 and is the lowest annual existing home sales number since 1995. Higher mortgage rates resulted in a lack of inventory and, consequently, record highs in home prices.
- The Dow Jones Industrial Average (DJIA) closed at 38,001.81 on Monday, January 22nd, which is a new record high for the index and the first time it has ever eclipsed the 38,000 level. The S&P 500 also advanced to a new closing-record high of 4,850 on Monday, one trading day after it broke the high last seen in January 2022.
- According to FactSet, 10% of the S&P 500 has reported Q4 results as of last Friday (1/19). The earnings growth rate, blended between companies that have already reported with the estimates for those that have yet to report, is at -1.7% year-over-year. Expectations for the earnings growth rate at the onset of earnings season was 1.6% year-over-year. The start to the fourth quarter earnings season has been relatively weak so far, with 62% of companies who have released actual results reporting earnings above estimates, which is below the 5-year average of 77% and the 10-year average of 74%. Note that the historical average reflects the historical actual results from all 500 companies, and only 10% of the S&P 500 had reported as of this past Friday.
Hot Reads
Markets
- Retail Sales Rose 0.6% in December, Topping Expectations for Holiday Shopping (CNBC)
- Labor Supply Helped Tame Inflation. It Might Not Have Much More to Give (WSJ)
- China Moves to Boost Bank Lending in Broad Effort to Prop Up Growth (WSJ)
Investing
- Six Life Lessons That Also Apply to Investing (David Booth)
- What is the Historical Rate of Return on Housing (Ben Carlson)
- Vanguard Got Bitcoin Right (MorningStar)
Other
- Exploring Hitler’s Eagle’s Nest (YouTube)
- Nick Dunlap Is Still a Mystery… Let’s Enjoy It (GolfDigest)
- Prostate problems are Incredibly Common. Here’s Why – and How to Treat Them (Nat Geo)
Markets at a Glance
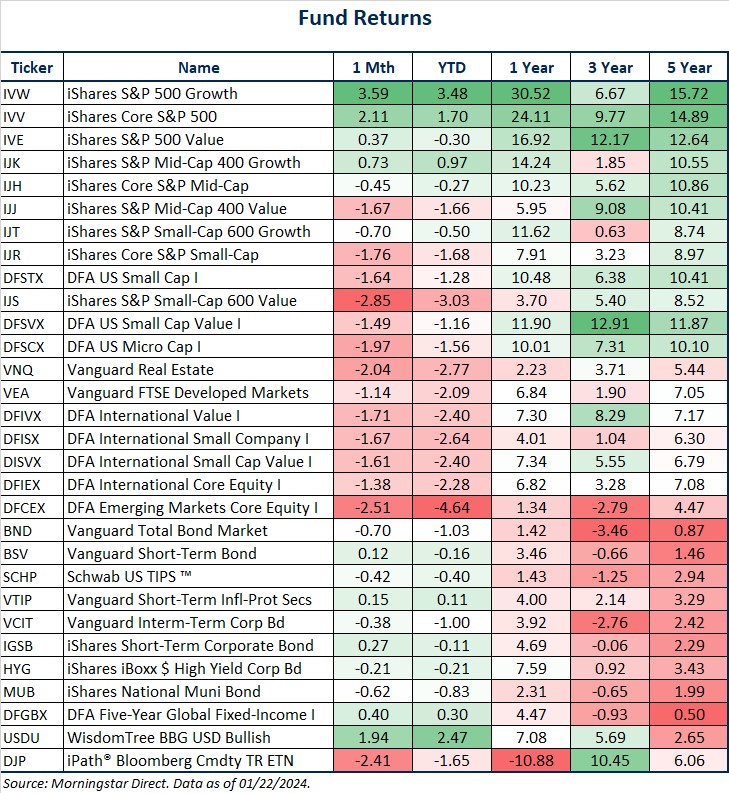
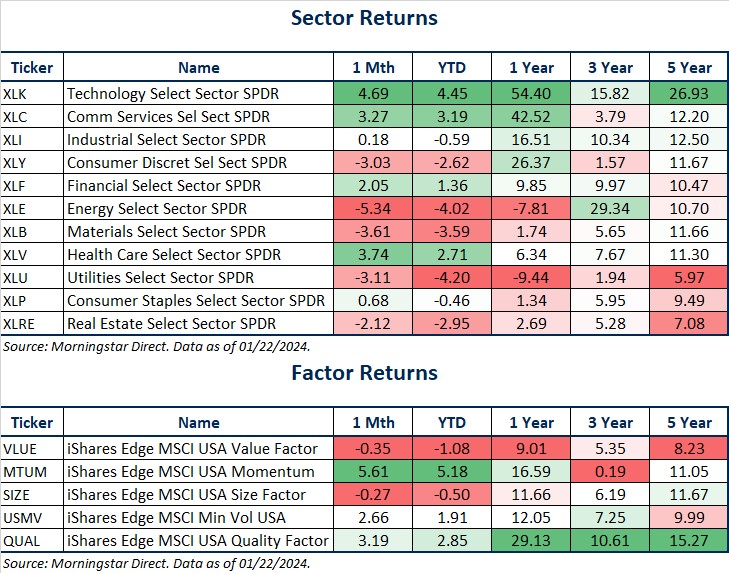
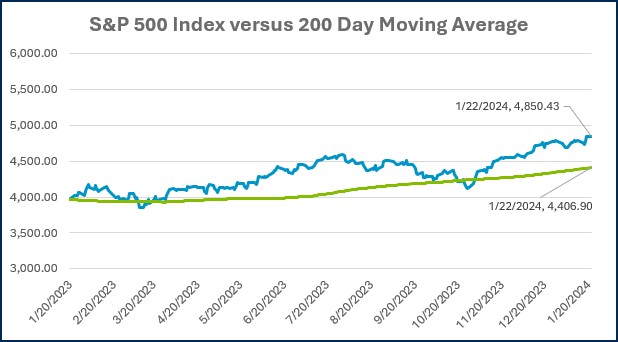
Source: Morningstar Direct.
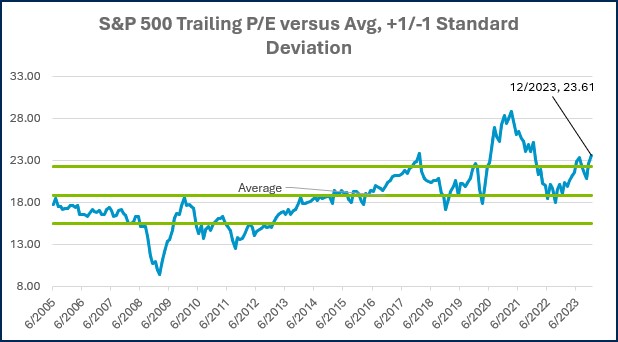
Source: Morningstar Direct.
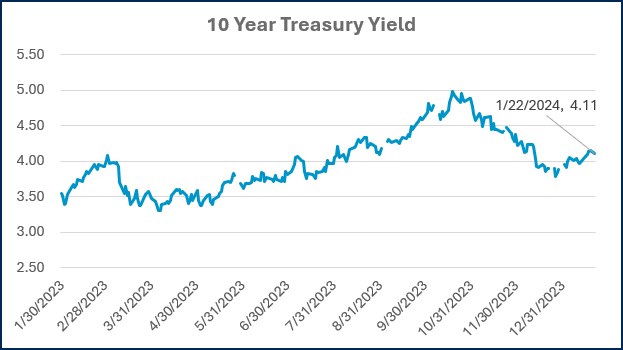
Source: Treasury.gov
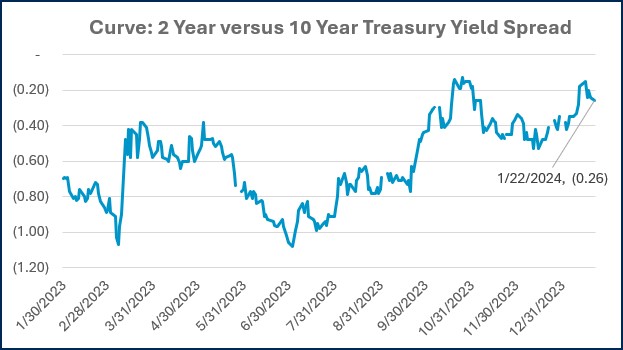
Source: Treasury.gov

Source: FRED Database & ICE Benchmark Administration Limited (IBA)
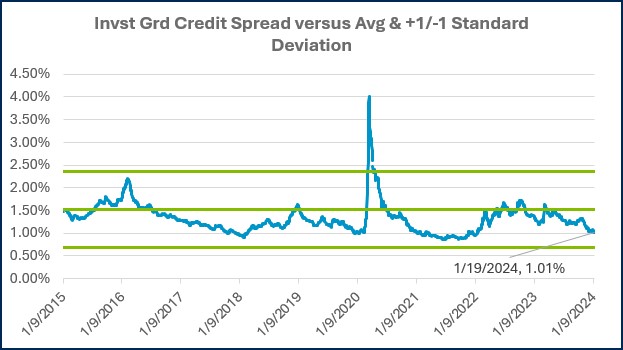
Source: FRED Database & ICE Benchmark Administration Limited (IBA)
Economic Calendar
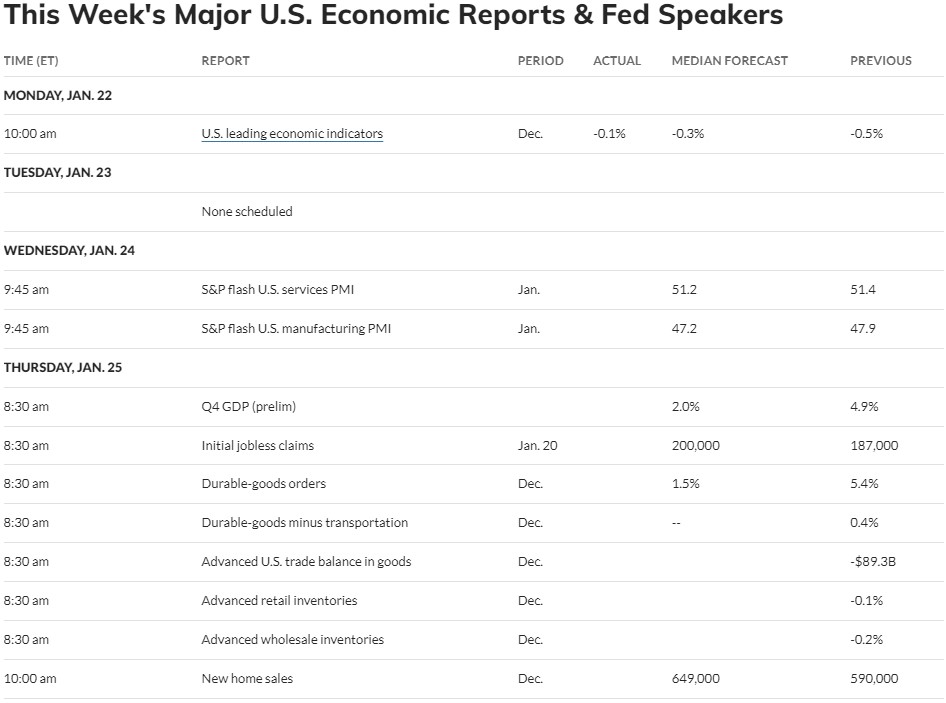
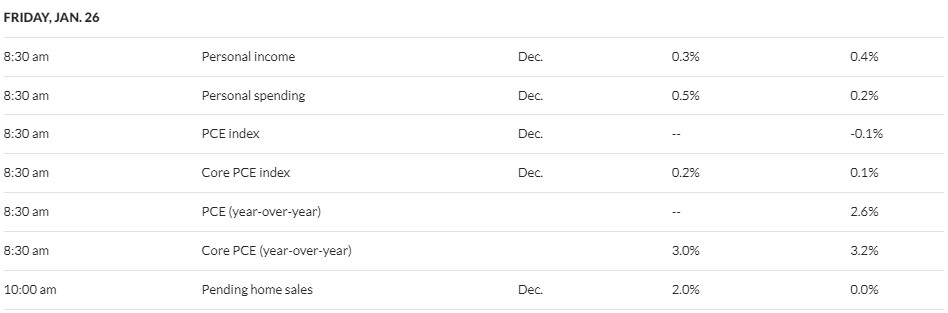
Source: MarketWatch

- Competition, Achiever, Relator, Analytical, Ideation
Josh Jenkins, CFA
Chief Investment Officer, Principal
Josh Jenkins is a Chief Investment Officer and Principal at Lutz Financial. He began his career in 2010. Josh leads the Investment Committee and specializes in assisting clients with portfolio construction, asset allocation, and investment risk management. He is also responsible for portfolio trading, research and thought leadership, and the division's analytics and operational efficiency. He lives in Omaha, NE.
Recent News & Insights

Accounting
How to Prepare for a Financial Statement Audit
Getting ready for an audit can feel daunting - from gathering countless documents to ensuring ...

Accounting
Are You Prepared? Financial Access Checklist for Spouses
Do you or your spouse handle most of your financial activities? If your spouse were not here ...

Market Commentary
Are AI Stocks in Trouble? + 1.29.25
The market had a rocky start to the week as the artificial intelligence (AI) industry ...

Financial Planning
Intra-Family Loans to Help a Family Member Purchase a Home
The Current Housing Market Challenge It has been well documented over recent years that it has ...


Let’s get you where you want to go.
We work to simplify complexities, help make critical business decisions, and confidently focus on the things that are truly important to you. We embrace your business as our own to spark the right solutions and help you thrive.