.jpg?width=300&height=175&name=Mega%20Menu%20Image%20(1).jpg)
%20(1).jpg?width=300&height=175&name=Mega%20Menu%20Image%20(2)%20(1).jpg)
%20(1)-Mar-08-2024-09-27-14-7268-PM.jpg?width=300&height=175&name=Untitled%20design%20(6)%20(1)-Mar-08-2024-09-27-14-7268-PM.jpg)

%20(1)-Mar-08-2024-09-11-30-0067-PM.jpg?width=300&height=175&name=Untitled%20design%20(3)%20(1)-Mar-08-2024-09-11-30-0067-PM.jpg)
%20(1).jpg?width=300&height=175&name=Mega%20Menu%20Image%20(3)%20(1).jpg)
%20(1).jpg?width=300&height=175&name=Mega%20Menu%20Image%20(4)%20(1).jpg)
%20(1).jpg?width=300&height=175&name=Mega%20Menu%20Image%20(5)%20(1).jpg)
-Mar-08-2024-08-50-35-9527-PM.png?width=300&height=175&name=Untitled%20design%20(1)-Mar-08-2024-08-50-35-9527-PM.png)


.jpg)


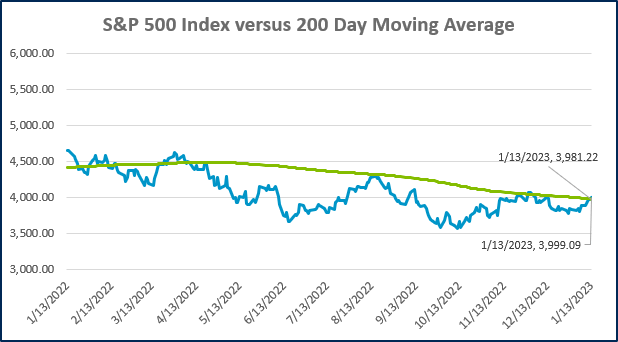
Last year the S&P 500 Index fell -18.1%, notching its worst annual return since 2008. While just about every corner of the stock market was down, some areas held up much better than others. The low-priced stocks that make up the S&P 500 Value Index, for example, only fell about -5.2% in 2022. The richly priced companies in the S&P 500 Growth Index, on the other hand, declined by a bruising -29.4%.
Decades of academic and practitioner research demonstrate a tendency for value to outperform growth. The chart below from Dimensional Fund Advisors (DFA) illustrates that track record. The left-hand side of the chart shows their annualized returns going back to the mid-1920s. Over that nearly 100-year period, value has returned 12.8% per annum, while growth returned 9.8%. The roughly 3% difference in annual return is referred to as the ‘Value Premium.’ Investors that wish to increase their expected return over time can tilt their portfolio toward value stocks in an effort to collect that premium.
Recent Value Performance in Context
July 1926 – November 2022
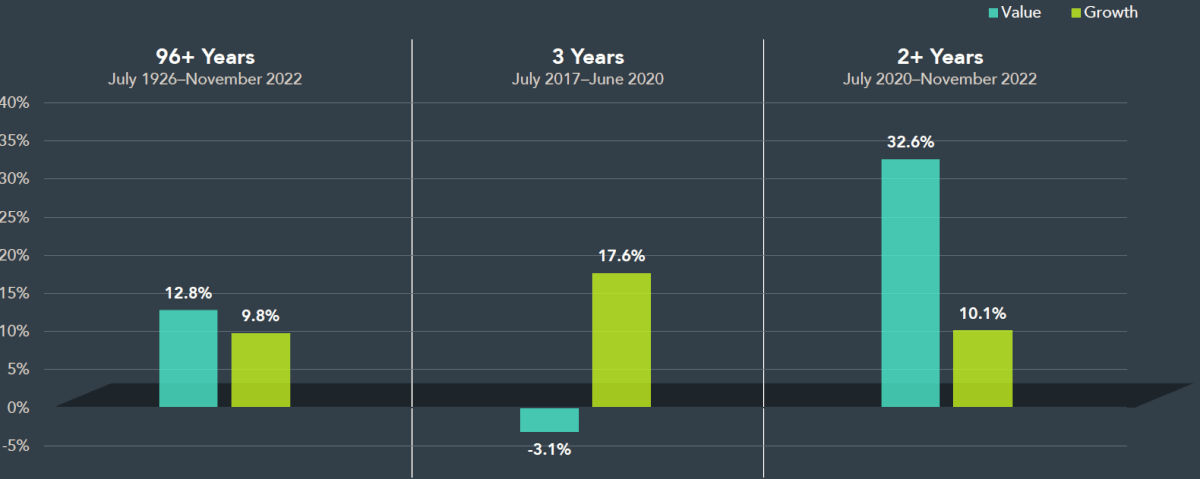
Source: Dimensional Fund Advisors. Performance data shown represents past performance and is no guarantee of future results. Value and growth stocks represented by the Fama/French US Value Research Index and the Fama/French US Growth Research Index, respectively. Returns provided by Ken French, available at http://mba.tuck.dartmout.edu/pages/faculty/ken.french/data_library.html. Eugene Fama and Ken French are members of the Board of Directors of the general partner of and provide consulting services to Dimensional Fund Advisors LP.
Although value has outperformed over time, that doesn’t mean it outperforms all the time. Since the 1920s, value has outgained growth in 59% of all rolling 12-month periods. While that may not seem like a material advantage, recognize that having the odds, even slightly in your favor in the short-term, can lead to a high probability of success in the long term. When measured over a longer period, such as five years, the frequency of value’s outperformance relative to growth increases to 71% of the time. On a ten-year basis, the frequency increases again to 80% of the time.
Despite having the odds in its corner historically, value has gone through some periods of substantial underperformance. We experienced such a time recently, as illustrated in the middle section of the above chart. The three-year period ending in June of 2020 saw value lag far behind growth. In fact, 2020 saw the worst three-year relative performance vs growth over the last (nearly) hundred years! This occurred as investors bid up the price of high-flying technology companies to dizzying heights. Tesla and the popular FANMAG stocks comprised of Facebook (Meta), Apple, Netflix, Microsoft, Amazon & Google (Alphabet) all provide good examples of this. Since that time, however, value has staged a dramatic comeback. As the right side of the chart illustrates, value has dominated since the second half of 2020, with a 32.6% annualized return vs growth at just 10.1%.
As the last few years have shown us, the relative performance between value and growth can shift in an abrupt and significant fashion. Unfortunately, it’s not possible for investors to time the market and get in and out of value at the most opportune moments. Investors that wish to benefit from the premium must not only tilt their portfolio towards value, but they must also have the discipline to remain in their seat until the premium shows up.
WEEK IN REVIEW
- Last week, the Bureau of Labor Statistics (BLS) provided an update on inflation. The Consumer Price Index (CPI) for December slowed for the 6th consecutive month, increasing by 6.5% on a year-over-year basis, down from 7.1% in November. Core CPI, which excludes the volatile food and energy categories, slowed to 5.7% from 6.% in November.
- Both CPI readings were in line with economist expectations and seem to confirm that inflationary pressures peaked in the middle of last year. The ‘shelter’ category rose 0.8% in December from the prior month. The shelter continues to be a large contributor to inflation, but economists expect that pressure to ease as existing leases are renewed with smaller rent increases. The market is currently pricing in a 94% probability that the Fed will again slow the pace of its tightening to a 0.25% hike at its next meeting, which concludes on February 1st.
- Notable economic data releases this week include retail sales, industrial production, capacity utilization, and the Fed Beige Book on Wednesday, jobless claims and an assortment of housing data on Thursday, and existing home sales on Friday. There will also be a handful of Federal Reserve speaking engagements sprinkled throughout the week.
ECONOMIC CALENDAR
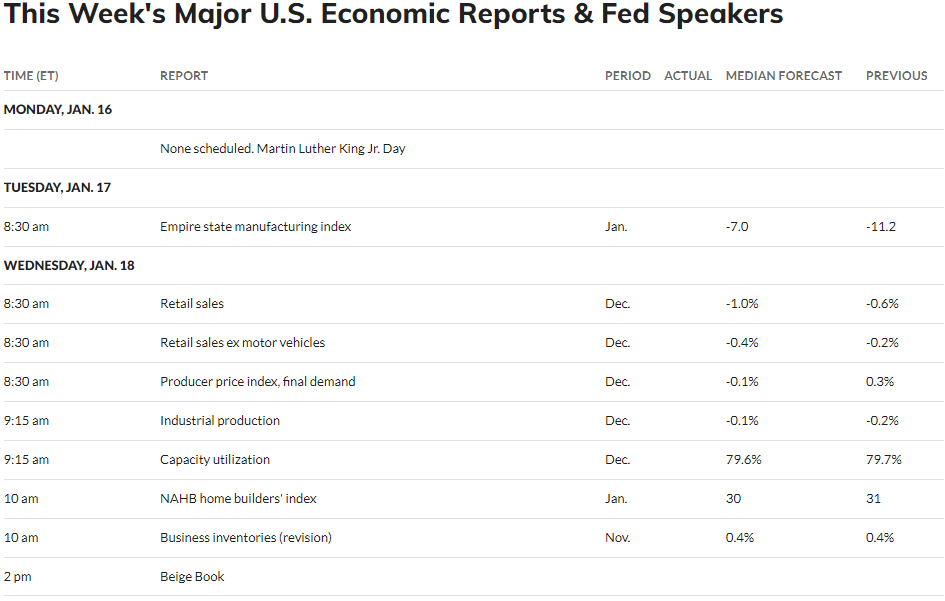
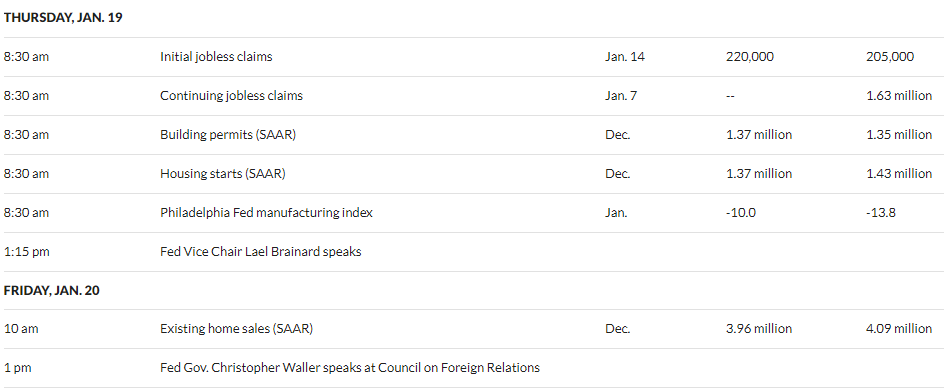
Source: MarketWatch
HOT READS
Markets
- Consumer Prices Fell 0.1% in December, In Line With Expectations from Economists (CNBC)
- Nonfarm Payrolls Rose 223,000 in December, as Strong Jobs Market Tops Expectations (CNBC)
- Shopper Rebellion Against Higher Prices Helps Slow Inflation (WSJ)
Investing
- Your Investing Strategy Just Failed. Its Time to Double Down (Jason Zweig)
- Why Markets Were Down in 2022 (Ben Carlson)
- Justifying Optimism (Morgan Housel)
Other
- 5 of The Most Dangerous Jobs in the World – Business Insider (YouTube)
- It’s Not Just You: 5G Is a Big Letdown (WSJ)
- China’s 1st Mars Rover and Tianwen 1 orbiter may have gone silent (Space.com)
MARKETS AT A GLANCE

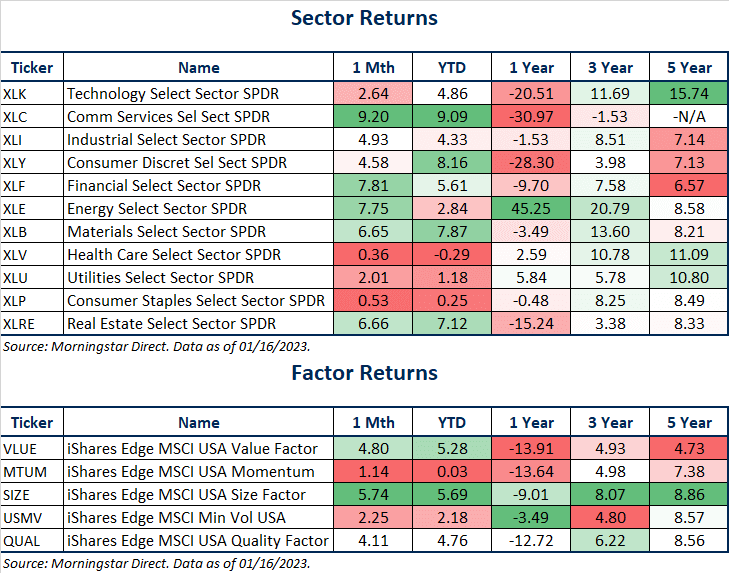
Source: Morningstar Direct.
Source: Morningstar Direct.

Source: Treasury.gov

Source: Treasury.gov
Source: FRED Database & ICE Benchmark Administration Limited (IBA)
Source: FRED Database & ICE Benchmark Administration Limited (IBA)

- Competition, Achiever, Relator, Analytical, Ideation
Josh Jenkins, CFA
Josh Jenkins, Chief Investment Officer, began his career in 2010. With a background in investment analysis and portfolio management from his previous roles, he quickly advanced to his current leadership position. As a member of the Lutz Financial Board and Chair of the Investment Committee, he guides Lutz Financial’s investment strategy and helps to manage day-to-day operations.
Leading the investment team, Josh directs research initiatives, while overseeing asset allocation, fund selection, portfolio management, and trading. He authors the weekly Financial Market Update, providing clients with timely insights on market conditions and economic trends. Josh values the analytical nature of his work and the opportunity to collaborate with talented colleagues while continuously expanding his knowledge of the financial markets.
At Lutz, Josh exemplifies the firm’s commitment to maintaining discipline and helping clients navigate market uncertainties with confidence. While staying true to the systematic investment process, he works to keep clients' long-term financial goals at the center of his decision-making.
Josh lives in Omaha, NE. Outside the office, he likes to stay active, travel, and play golf.
Recent News & Insights

Lutz Announces Ryan Cook as New Managing Shareholder

Decoding Performance: Analyzing Your Monthly Financial Statements

Benefits of Temporary Staffing

Financial Planning Advice for Recent College Grads

