%20(1)-Jan-02-2024-09-05-00-8712-PM.jpg?width=300&height=175&name=Untitled%20design%20(2)%20(1)-Jan-02-2024-09-05-00-8712-PM.jpg)
%20(1)-Mar-08-2024-09-22-41-1011-PM.jpg?width=300&height=175&name=Untitled%20design%20(5)%20(1)-Mar-08-2024-09-22-41-1011-PM.jpg)
%20(1)-Mar-08-2024-09-27-14-7268-PM.jpg?width=300&height=175&name=Untitled%20design%20(6)%20(1)-Mar-08-2024-09-27-14-7268-PM.jpg)

%20(1)-Mar-08-2024-09-11-30-0067-PM.jpg?width=300&height=175&name=Untitled%20design%20(3)%20(1)-Mar-08-2024-09-11-30-0067-PM.jpg)
%20(1)-Mar-08-2024-09-18-53-4361-PM.jpg?width=300&height=175&name=Untitled%20design%20(4)%20(1)-Mar-08-2024-09-18-53-4361-PM.jpg)
-Mar-08-2024-09-03-21-1119-PM.jpg?width=300&height=175&name=Untitled%20design%20(1)-Mar-08-2024-09-03-21-1119-PM.jpg)
-2.png?width=264&height=160&name=Website%20Featured%20Content%20Images%20(1)-2.png)
-Mar-08-2024-08-50-35-9527-PM.png?width=300&height=175&name=Untitled%20design%20(1)-Mar-08-2024-08-50-35-9527-PM.png)


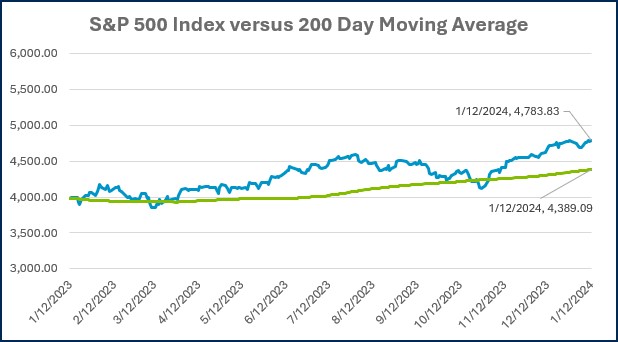
2023 was a great period for the U.S. stock market. The S&P 500 Index delivered a 26.3% return, easily beating market expectations at the onset of the year. The final two months were particularly strong as the market began to price in a Federal Reserve policy shift from hiking to cutting rates in 2024. Stocks gained a whopping 14.1% in November and December alone, making it the 14th highest 2-month gain dating back to 1940.
As we look forward, investors want to know what to expect after such a dramatic gain. Can the market rally continue? Or should we brace for a pullback? There are certainly risks that would suggest the need for caution:
- The market rally, based on the expectations for a monetary policy shift, might have been overdone.
- The market is expecting the Fed to reduce the benchmark rate by 1.5% in 2024. It’s possible the Fed will keep rates higher for longer by not cutting, delaying cuts, or not cutting by as much as the market expects.
- Much of the stock market’s gain was concentrated in the largest stocks. This makes the market vulnerable to a pullback if those large companies come under pressure.
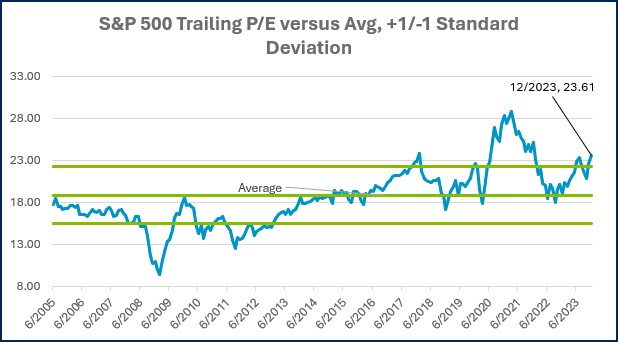
- Stock market valuations, particularly among those largest stocks, are stretched.
- The impact of tighter monetary policy impacts the economy with a long and variable lag. It is possible that the impact has not yet been fully felt. This would decrease the odds of a ‘soft landing’ for the economy.
- Inflation could reaccelerate.
- Earnings season could disappoint.
On the other hand, market momentum provides us with at least one reason for optimism. The table below illustrates the twenty largest 2-month return periods for U.S. Large-cap stocks since 1940. As mentioned earlier, the 14.1% return for the two months ending last December ranked 14th (out of 1,108) during the 84-year window.
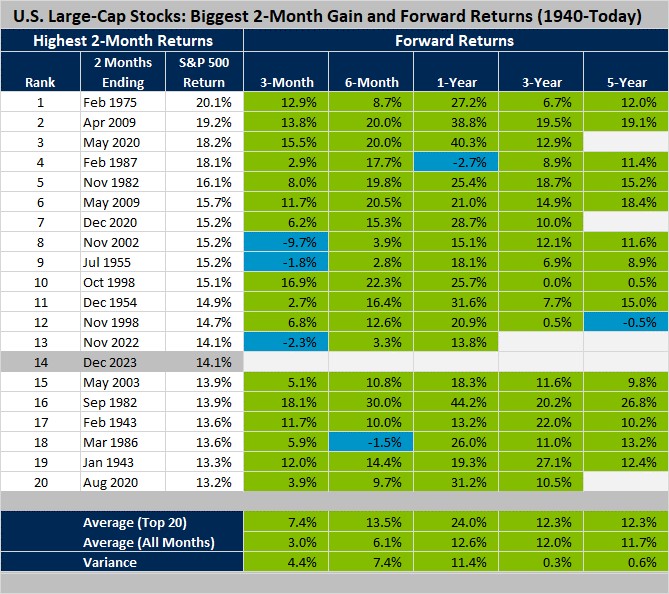
Source: Morningstar Direct. Large Cap Stocks are represented by the IA SBBI Large Cap Stock TR Index. Data from 1940 through 1923, Periods longer than 1 year were annualized.
As you can see, there has been a strong historical tendency for market strength to persist after an explosive two-month return like we just experienced.
- The market was positive over the subsequent three months 16 of the last 19 times this has happened (84% of the time).
- The returns over the subsequent 6-month, 1-year, 3-year, and 5-year periods were nearly always positive (93% to 100% of the time).
- The average return in the subsequent three months (7.4%) was roughly double the typical three-month return of 3.0% since 1940.
- The subsequent 6-month and 1-year returns were also roughly double the typical averages.
- The subsequent 3 and 5-year returns were slightly above the typical averages.
Where does the market go from here? It is impossible to know unless you can say with certainty what will happen with economic growth, the labor market/wages, the path of inflation, the Federal Reserve’s reaction to this data, business earnings, overall market sentiment, and countless other variables. The global economy is far too complex to predict. The professional forecasters were reminded of this last year as their outlooks proved to be laughably wrong.
There are reasons to be both cautious and optimistic, as is almost always the case.
Week in Review
- The December CPI data released on January 11th showed that prices rose .3% from the prior month and 3.4% from a year earlier, a slight increase from the year-over-year number seen in November of 3.1%. Core CPI, which excludes food and energy prices, rose .3% month-over-month and 3.9% year-over-year, which is the first annual core inflation rate reading below 4% since May of 2021. Within Core CPI, rising shelter costs accounted for more than half of the monthly increase as shelter costs rose .5% for the month.
- With fourth-quarter earnings season upon us, analysts at FactSet released their blended earnings growth estimate of -.1% year-over-year for Q4 S&P 500 earnings. If the estimate comes to fruition, it will mark the fourth time in the past five quarters that the S&P 500 has reported a year-over-year earnings decline. That blended earnings growth rate estimate combines companies that have already reported with the estimates for those that have yet to report. The actual earnings growth rate for S&P 500 companies has exceeded the estimated earnings growth rate in 37 out of the past 40 quarters. This is a common occurrence as company management often sandbags earnings expectations heading into earnings season to help them ‘beat’ expectations.
- While US Bond & Equity markets were closed on Monday, the S&P BSE Sensex Index, which tracks the Indian stock market, reached a record high. The country’s equity index has surged in the past few months as India has experienced strong economic growth. The Nikkei 225, an equity index that tracks the largest 225 companies in Japan, also reached highs not seen since 1990.
Hot Reads
Markets
- Fed’s Christopher Waller Advocates Moving ‘Carefully’ With Rate Cuts (CNBC)
- Consumer Prices Rose 0.3% in December, Higher Than Expected, Pushing the Annual Rate to 3.4% (CNBC)
- Fed Tiptoes Toward Dialing Back Key Channel of Monetary Tightening (WSJ)
Investing
- The Holy Grail of Portfolio Management (Ben Carlson)
- Will Value Stocks Take the Lead In 2024 (Morningstar)
- Active vs. Passive Learning (Morgan Housel)
Other
- Tiger Woods Long Drive Contest (YouTube)
- Travis and Jason Kelce Attempt to Explain NFL Defenses to New Fans of the Game – New Heights Podcast (YouTube)
- The 11 Best Pickleball Paddles, According to Instructors and Racket Sport Experts (WSJ)
Markets at a Glance
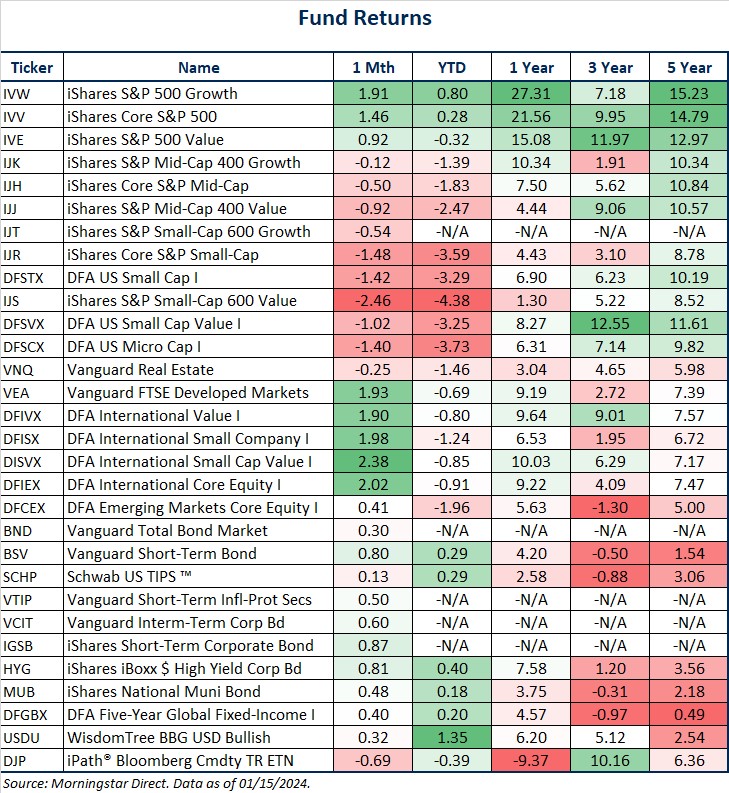
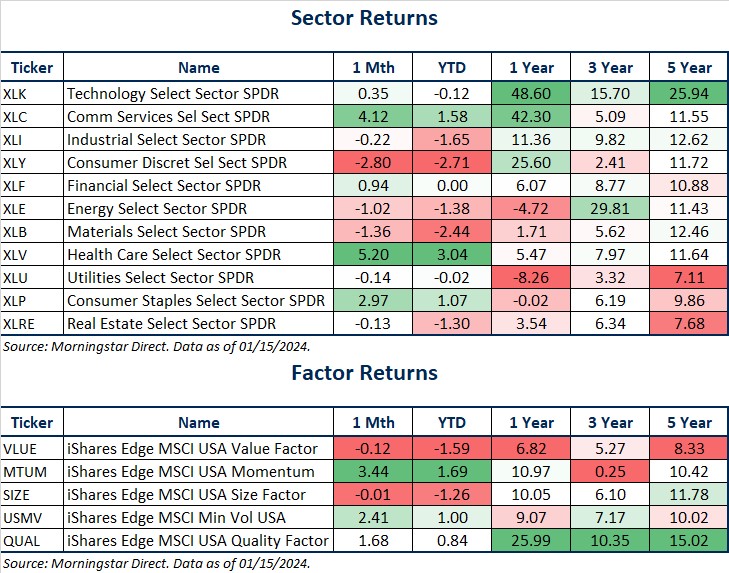
Source: Morningstar Direct.
Source: Morningstar Direct.
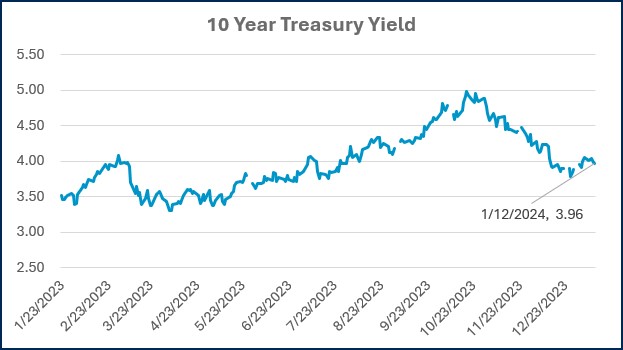
Source: Treasury.gov
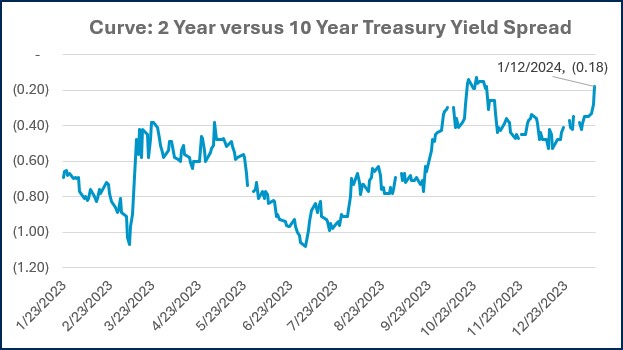
Source: Treasury.gov
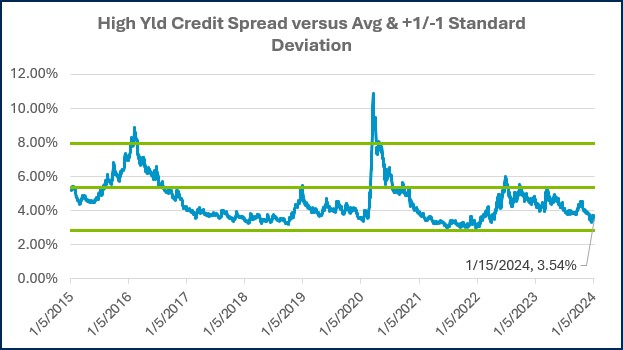
Source: FRED Database & ICE Benchmark Administration Limited (IBA)

Source: FRED Database & ICE Benchmark Administration Limited (IBA)
Economic Calendar
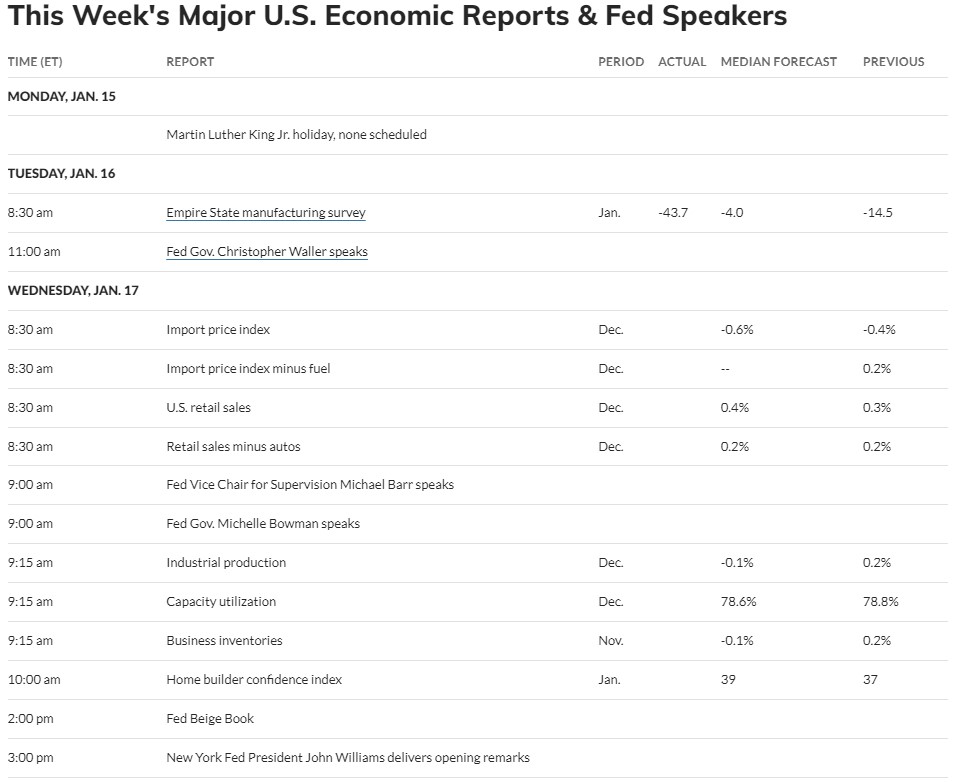
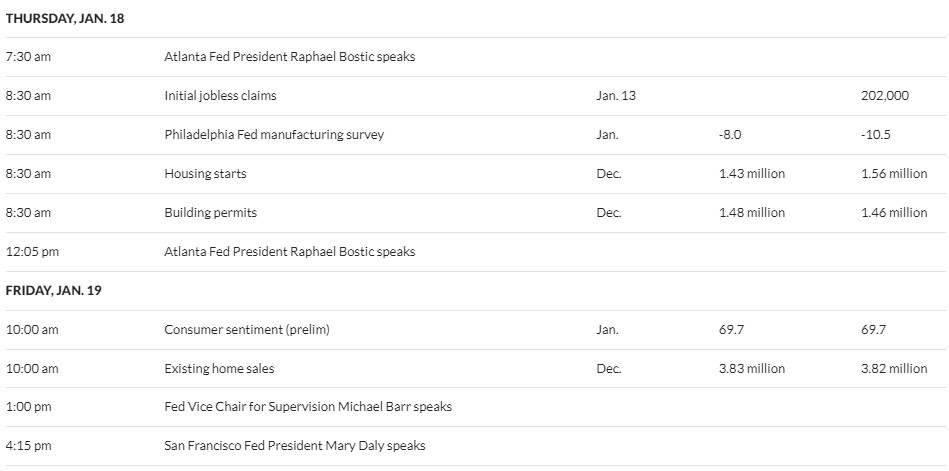
Source: MarketWatch

- Achiever, Competition, Ideation, Significance, Command
Josh Jenkins, CFA
Chief Investment Officer, Principal
Josh Jenkins is a Chief Investment Officer and Principal at Lutz Financial. He began his career in 2010. Josh leads the Investment Committee and specializes in assisting clients with portfolio construction, asset allocation, and investment risk management. He is also responsible for portfolio trading, research and thought leadership, and the division's analytics and operational efficiency. He lives in Omaha, NE.
Recent News & Insights

Human Resources
What is HR and What Do They Do?
When you hear the term “human resources” or HR, what comes to mind? For many, it’s the ...

M&A
Exit Planning Strategies for a Successful Business Transition
As a business owner, you've likely poured years of hard work, dedication, and passion into ...

Client Advisory Services
Employee or Contractor? A Critical Hiring Decision
Hiring new talent is an exciting milestone for any company. Whether bringing on your first ...

Cybersecurity
How to Spot the Scam: 3 Ways to Avoid Email Phishing Attacks
If you spend any time at all using email, you’ve probably seen it—a legitimate-looking (or ...


Let’s get you where you want to go.
We work to simplify complexities, help make critical business decisions, and confidently focus on the things that are truly important to you. We embrace your business as our own to spark the right solutions and help you thrive.